Netflow vs metadata vs packet inspection
Overview
With each passing year, IT engineers are facing the increasing struggle of how to stay ahead of monitoring the traffic on their networks. Speeds and feeds have increased, while interface costs have largely come down. That 40Gbps connection used to be something we dreamed of – now suddenly it is here. Along with this trend, attacks, breaches, and intrusions have been on the rise. Most IT personnel realize that now is the time to put a monitoring method in place if they have not done so already. But how?
There are three common approaches to collecting and reporting the data that traverses networks. NetFlow (or any flow-based flavor of monitoring), packet data, and metadata. But which is right for you and the environment you are tasked with troubleshooting and protecting?
This paper will break down the monitoring approach of each method, discuss its strengths and weaknesses, and offer best practices for the right times to use it. Let’s start with what some consider to be the golden standard of analysis – packet data.
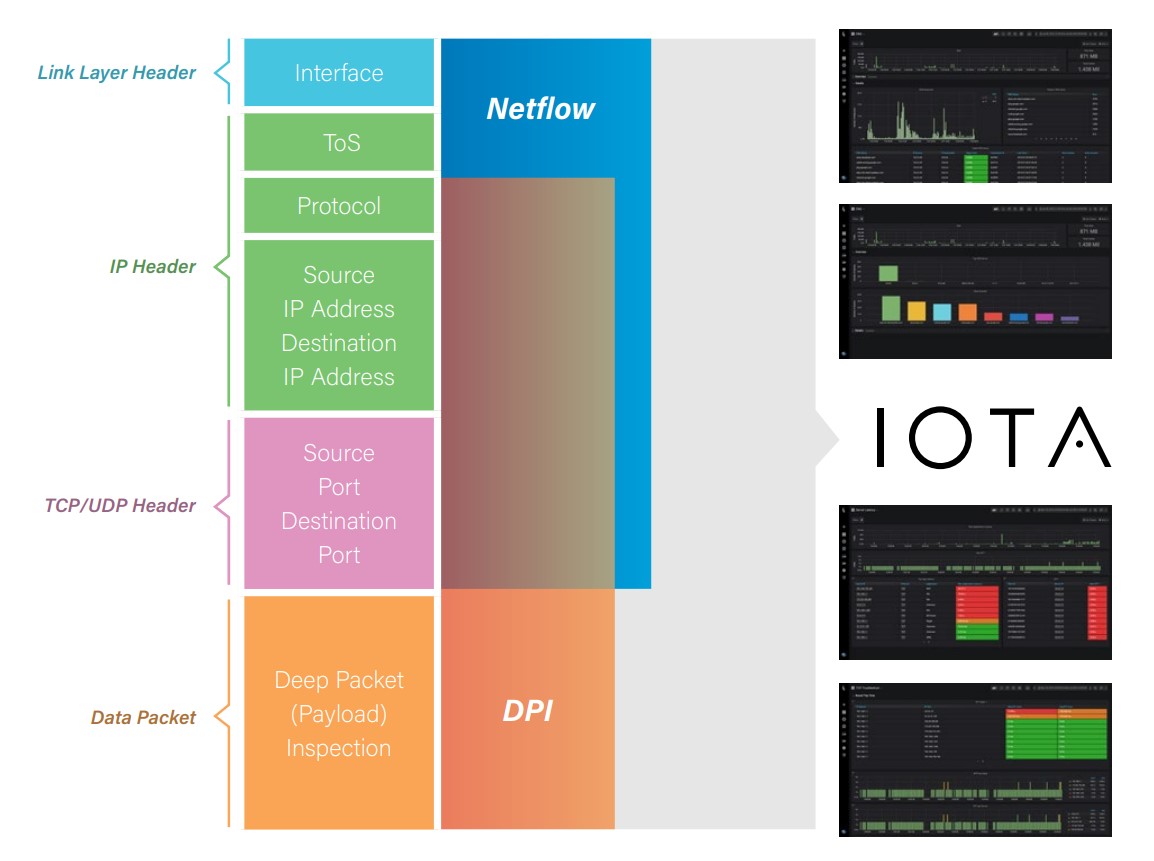
Deep Packet Inspection
Packets are the most detailed monitoring method available. In fact, the other two methods mostly use packet data to create the statistics they generate. With packet data we can measure inter-packet timing, server response time, and even decrypt the flow to look at the application payload.
Pros: Details, details, details.
It’s all there in the packets. Every bit, byte, and header value available for a full picture of what really happened when the problem struck. Some problems can only be seen in the raw packet data, which truly allows the full picture to be analyzed. For example, if a problem is due to a low MSS value in a TCP connection, packet data enables the analyst to not only see this issue in the TCP conversation, but correlate that to the expected ICMP messages from the network.
Cons: Data overload!
It is very easy to lose a needle in the haystack of packets. Especially when capturing on high-speed, high-capacity links, packet data can quickly become overwhelming. Consider this – capturing for five minutes on a 10Gbps link that is only 50% utilized will result in a packet capture of almost 200GB! This makes troubleshooting back-in-time difficult simply because it is hard to store enough data to see beyond the last few hours or days.
Digging through packets takes skill, experience, and patience. While it is the most detailed method, a balance is needed based on the goals of the analysis.
NetFlow (or other flow-based methods)
Analyzing network traffic doesn’t require digging into the weeds in every case. Sometimes high-level statistics are enough to help us achieve our goals. It just depends on what we are looking for. NetFlow is a summary of IP traffic that is generated by network infrastructure devices, which is then sent to collectors to generate pretty graphs of traffic data.
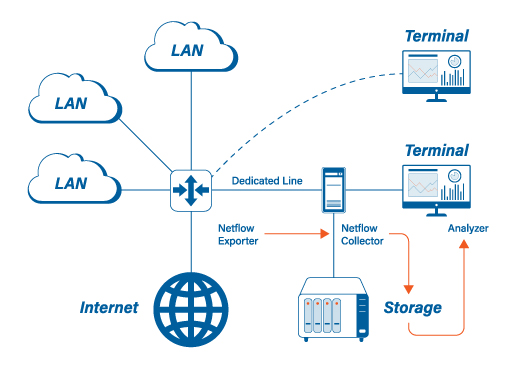
Pros: Long-term monitoring, simple to read.
Flows give the right amount of statistics needed to find network intrusions, and to identify top talkers and causes of high utilization. To do that however, we don’t need the deep-dive detail of every packet in the flow. Most flow solutions provide the IP addresses, TCP or UDP port numbers, DiffSrv values, time of flow, length of flow, and amount of data in flow. Many of these monitoring systems allow analysts to look at flows from days, weeks, and even months in the past.
Cons: No packet payload, network RTT or server response time.
Since NetFlow looks at a stream of packets in one direction as a single statistic, it does not provide the timing details to allow for the measurement of network roundtrip time or inter-packet delay. Header details such as TCP flags, window size, and handshake options are not collected, which are critical when troubleshooting complex issues.
In short, if the goal of monitoring traffic is to watchdog the network over an extended period of time for forensics and security, NetFlow is the ideal tool.
Metadata
This method provides a sweet spot between the other two options. Packet data is collected by an analyzer where it is sorted, parsed, indexed and even stored (in some cases). This allows graphs and statistics about network traffic, usage, bandwidth, and even application performance to be generated and stored long term. It provides packet-level detail for most common troubleshooting exercises, without the complexity of digging through a huge pcap.
Pros: More detail over NetFlow, without the packet complexity, long term indexing.
Statistics such as iRTT, application response, TCP retransmissions, and DNS response codes can be monitored and graphed over time, allowing an analyst to measure them and spot pain points. If for any reason more detail is needed than that provided by the metadata, such as traffic decryption, packets can be filtered and exported for a more focused deep-dive.
Cons: Hardware resource, data loss
The tool needs plenty of resource to do line-rate analytics, which is often very expensive. Since so much is happening under the hood to turn packets into long-term metadata, the machine doing the crunching needs some serious horsepower. There is also clear risk of data loss or overprovisioning, especially on high-speed links.
Putting 2 and 2 together
The IOTA takes the strengths of these three analysis methods and brings them together into a compact, portable, and cost-effective tool. It is able to harness the power of packet collection by streaming data to a 1TB encrypted drive (extendable to external storage) while simultaneously performing linerate analytics on ingress data.
Key performance and forensic data can be accessed and analyzed using built-in dashboards. Bandwidth utilization, DNS performance, TCP metrics, Application Latency, User Experience, and much more can be monitored on custom screens that are built with the exact data needed to spotlight problems. This enables IT personnel of all experience levels to both proactively and reactively resolve network issues.
For forensic analysis, traffic can be viewed by conversation flow, GeoIP location, or bandwidth consumption when searching for intrusions or breaches. When troubleshooting slow performance, packet-level statistics such as network latency, TCP metrics, and server response time can point the way to the root cause. If packets become necessary for deeper digging, a filtered, exportable trace file is just a click away.
With IOTA, harness the detail of packets, the simplicity of NetFlow, and the power of metadata on one single pane of glass – all without breaking the bank!