Troubleshooting DNS
Learn more about the IOTA solution at profitap.com/iota
Problem description
There is a saying: “It's not DNS. There is no way it’s DNS. It was DNS”. This makes it clear that DNS is an integral part of IT infrastructure services and can exhibit a wide variety of error patterns. For example, DNS can lead to applications not starting or starting with delays. Sometimes, this is due to incorrectly stored DNS records or performance bottlenecks on DNS servers. However, overly restrictive firewalls cause problems in some cases since some system integrators only support DNS over UDP. With large responses, however, DNS switches to TCP. Certificate errors in browsers can also indicate incorrect DNS entries.
Troubleshooting workflow
The following example provides a step-by-step guide overview of how analysis of DNS traffic with Profitap IOTA can be done. Different error patterns are used for this purpose.
Starting the capture
In the first step, we have to configure the physical interface. To do this, we navigate to the Capture > Interface Configuration page from the left menu tree. In the configuration shown, the interface is configured in SPAN mode with 10/100/1000 Mbit/s Auto-Negotiation, so both physical interfaces can receive traffic to be analyzed from a SPAN port or a TAP. If the IOTA is to be integrated inline into the data stream, the box next to Inline Mode must be checked and the Save button clicked.
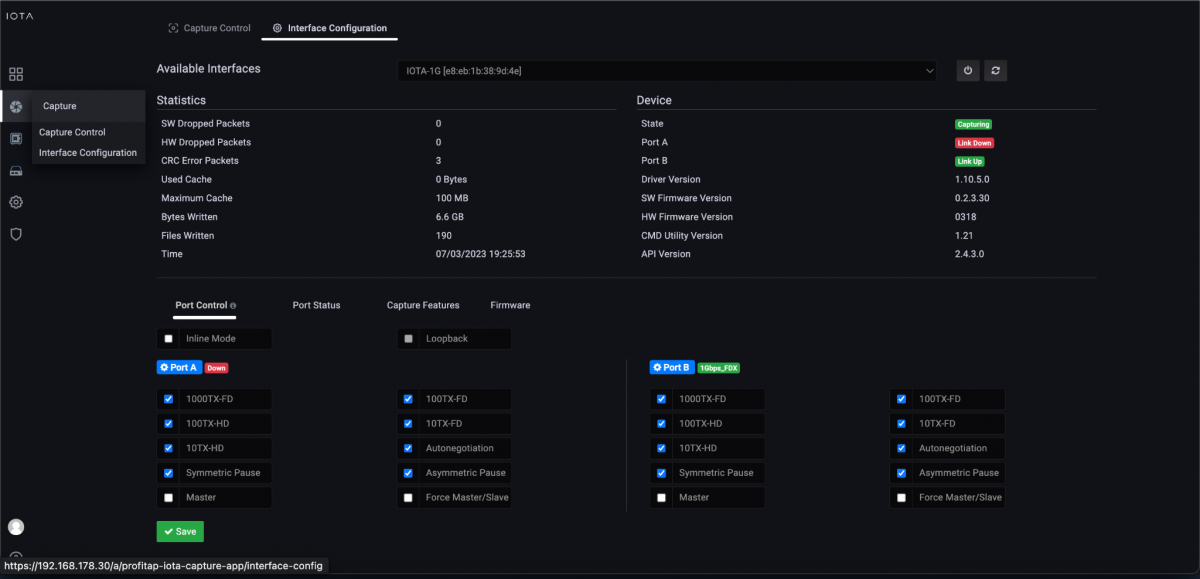
Figure 1: Configuration of the physical interfaces. In this case, 10/100/1000 Mbit/s Auto-Negotiation in SPAN Mode.
After preparing the physical interface, we connect the appropriate cables and start the capture process on the Capture Control page by clicking the Start Capture button.
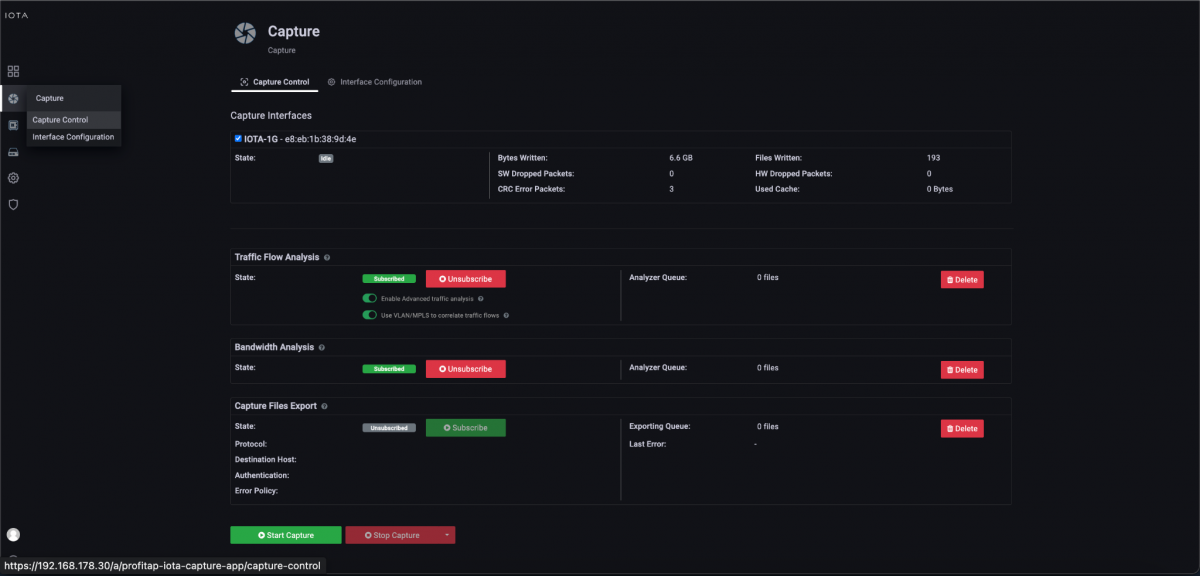
Figure 2: Starting the capture via the “Start Capture” button on the “Capture Control” page.
A high number of requests / DNS server performance problem
In the problem description, the performance of the DNS server was very poor. Responses arrived from the client only with a delay. This is why we first want to check whether there was a server problem or an unusually high number of DNS queries and, if so, from which clients these were triggered, so that we can isolate this from the network.
To do this, we switch from the initial Overview Dashboard to the DNS Overview Dashboard via the Navigate menu in the upper right corner of the screen.
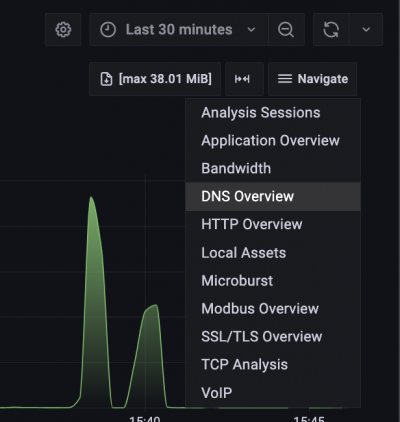
Figure 3: Switching from the “Overview” to the “DNS Overview” dashboard via the “Navigate” menu.
In the DNS Overview dashboard, we can see the total number of DNS requests in a specific time interval and a breakdown by target DNS servers and target domains.
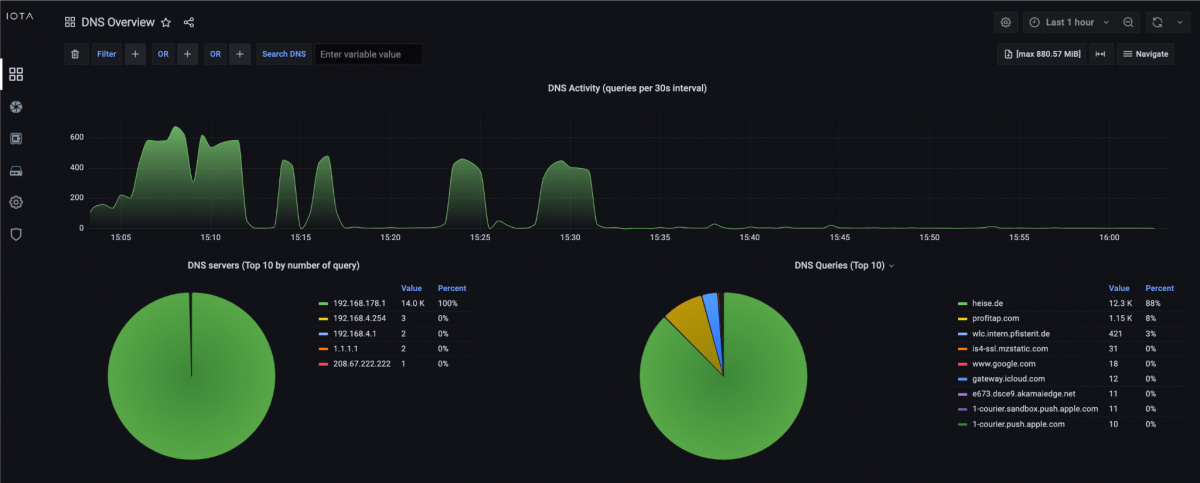
Figure 4: DNS Overview Dashboard with a high number of DNS requests of a domain.
Based on this information, we can directly see that in the time interval of the last hour, sometimes up to 600 DNS requests were sent, which is unusual in a small network. 14,000 requests were made to the DNS server 192.168.178.1, and 12,300 requests were made for the domain 'heise.de'.
In the following, we can use the Search DNS function and filter for requests for the domain 'heise.de'.

Figure 5: Filters via the “Search DNS” function based on the domain 'heise.de'.
We can then scroll down to the flow table within the DNS Overview dashboard (Figure 6). This flow table shows that starting from the fourth line, the client 192.168.178.22 made DNS requests for the target domain 'heise.de' several times per second, but no subsequent connection was established. The three flows at the top of the list show that TCP and TLS connections were established based on the DNS response.
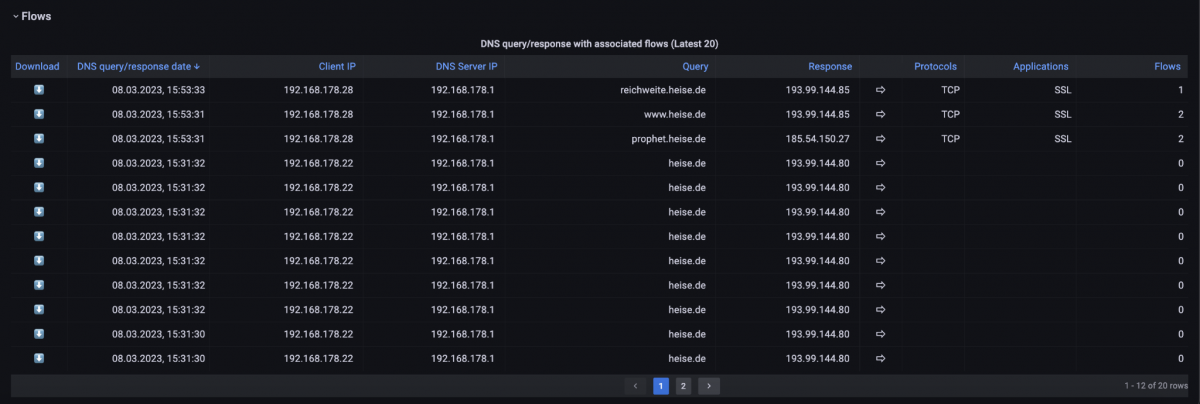
Figure 6: DNS flow table.
The behavior of client 192.168.178.22 indicates a client-side error, which must be analyzed on host 192.168.178.22. Until it is fixed, the client could be isolated from the network. In this example, a DNS request loop in an application on the client was the cause.
Slow DNS response time
To analyze a slow application start, an analysis of the DNS response time helps in many cases. The PCAPNG download of individual DNS requests/answers and the associated TCP and, if applicable, TLS flow can help.
As in the previous example, we filter by using the Search DNS function, and scroll to the flow table. On the left edge, as seen in Figure 6, a single click on the arrow button next to the respective flow starts the download of this flow in PCAPNG format. This provides DNS Request, Response, and the associated TCP and possibly TLS flows for download.
We can quickly determine the DNS response time using a display filter 'dns' and a column with the delta time to the previous packet.
In the example, this was 12.5 ms, which is a normal value.

Figure 7: PCAPNG displayed in Wireshark.
Certificate errors in the browser
If users receive certificate errors in the browser or other applications, this can also indicate errors in DNS. To analyze which IP address the client received from the DNS server in response to a DNS A-record query, we use the DNS Overview dashboard again. We filter for the desired domain name by applying the 'SERVER_HOST_NAME_DNS = profitap.com' filter.

Figure 8: Filtering on the server name “profitap.com” in the DNS request dashboard.
As a result, we can see the DNS query requests and responses in the filtered flow table. In the example below, the IP address 217.160.0.226 was delivered for the DNS query of the profitap.com A-record. Based on this data, we can compare the intended destination IP address and the destination server or a check of a TLS handshake and the delivered certificate via tools such as openssl s_client.

Figure 9: Flow with DNS query on A-record profitap.com. We recognize the IP address 217.160.0.226 as the response.
IOTA Benefits
In addition to simple and quick-to-use filters, Profitap IOTA offers a wide range of options for DNS analysis. The DNS Overview dashboard provides quantitative graphical evaluations and data on DNS servers used and target domains. For example, it would be very easy to detect misconfigured clients that request the wrong DNS servers. The flow table in the dashboard mentioned above is a particularly helpful tool for application analysis, enabling correlations between DNS and subsequent TCP sockets and TLS handshakes to be detected and downloaded if necessary.
Learn more about the IOTA solution at profitap.com/iota