Application Latency Analysis
Learn more about the IOTA solution at profitap.com/iota
Problem description
More and more applications are provided by cloud providers as SaaS from globally distributed data centers. Normally, this offers easy application deployment. However, it also brings new error sources that can affect application performance. For example, latency issues can lead to sluggish applications and even timeouts in those applications. With packet loss, similar behavior occurs, and retransmissions are visible.
Real-time applications, particularly video conferencing via Microsoft Teams or WebEx, react very sensitively to such error patterns. High latencies also negatively affect application performance in legacy applications with direct sequential database queries over a WAN link.
If applications freeze up, this is in many cases due to TCP Zero Windows. When this happens, the network has transmitted the user data correctly, but the server or client cannot process it further due to local performance limitations.
In addition, SD-WAN solutions with a combination of WAN links with different bandwidth, packet loss, and latency characteristics are increasingly being used. If, despite positive representations in the associated management solutions, application performance is not satisfactory, a familiar game quickly gets underway: finger-pointing between those responsible for the application, client, server, and network.
Profitap IOTA wants to counteract this by simplifying troubleshooting with intuitive dashboards and reliable traffic capture.
Troubleshooting workflow
The following example gives a step-by-step overview of how an analysis of reduced application performance can be done with Profitap IOTA. The example used is a sluggish and freezing Office 365 application.
As the first step, we need to configure the physical interface. To do this, we navigate to the Capture menu in the left menu tree, and then to the Interface Configuration page.
In the configuration shown, the interface is configured in SPAN mode with 10/100/1000 Mbit/s Auto-Negotiation, so both physical interfaces can receive traffic to be analyzed from a SPAN port or a TAP.
If the IOTA is to be integrated inline in the data stream, the box next to Inline Mode must be checked and the Save button clicked.
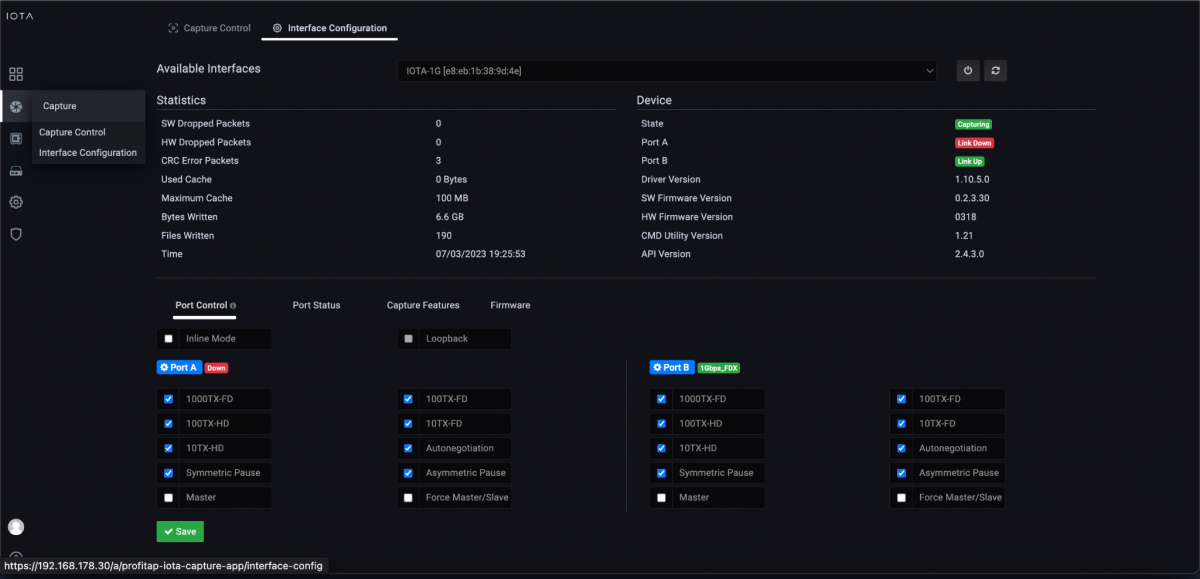
Figure 1: Configuration of the physical interfaces. In this case, 10/100/1000 Mbit/s Auto-Negotiation in SPAN mode.
After we have prepared the physical interface, we connect the corresponding cables and start the capture process on the Capture Control page by clicking the Start Capture button.
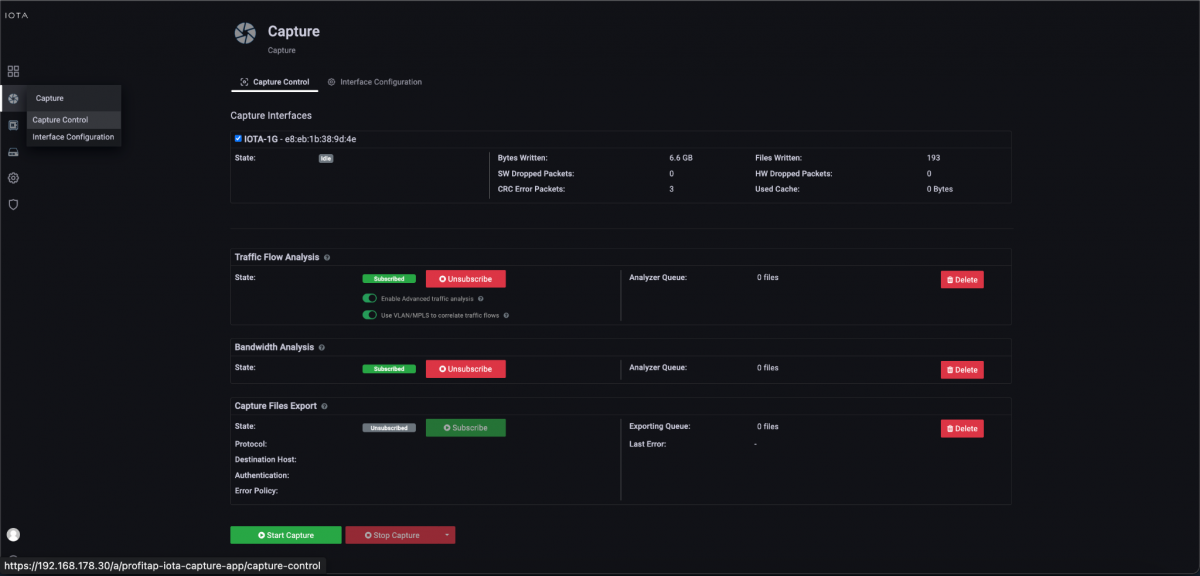
Figure 2: Starting the capture via the “Start Capture” button on the “Capture Control” page.
First, we set a filter on the Overview dashboard for the Office 365 application and the source IP address of the affected client. This allows us to quickly narrow down the affected communication relationship.
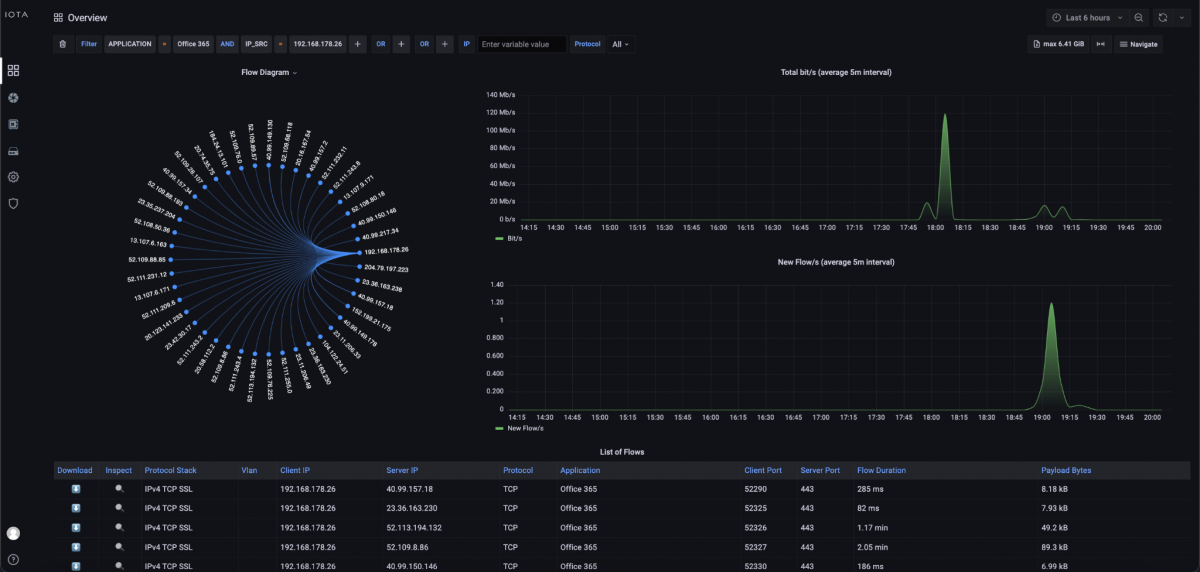
Figure 3: Filter on Office 365 and source IP address of the client; in this case, 192.168.178.26.
Since Office 365 establishes TCP communication on port 443 (HTTPS) to the respective target server, we focus on this communication pattern. To do this, we switch to the TCP Analysis dashboard via the Navigate menu in the upper right corner of the screen.
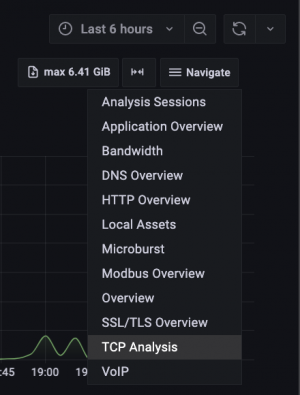
Figure 4: Switch to TCP Analysis.
In the TCP Analysis dashboard, we immediately recognize the strong spike of the initial round trip time to the server '52.111.232.11' and the server hostname 'messaging.engagement.office.com' using the descending iRTT sorting.
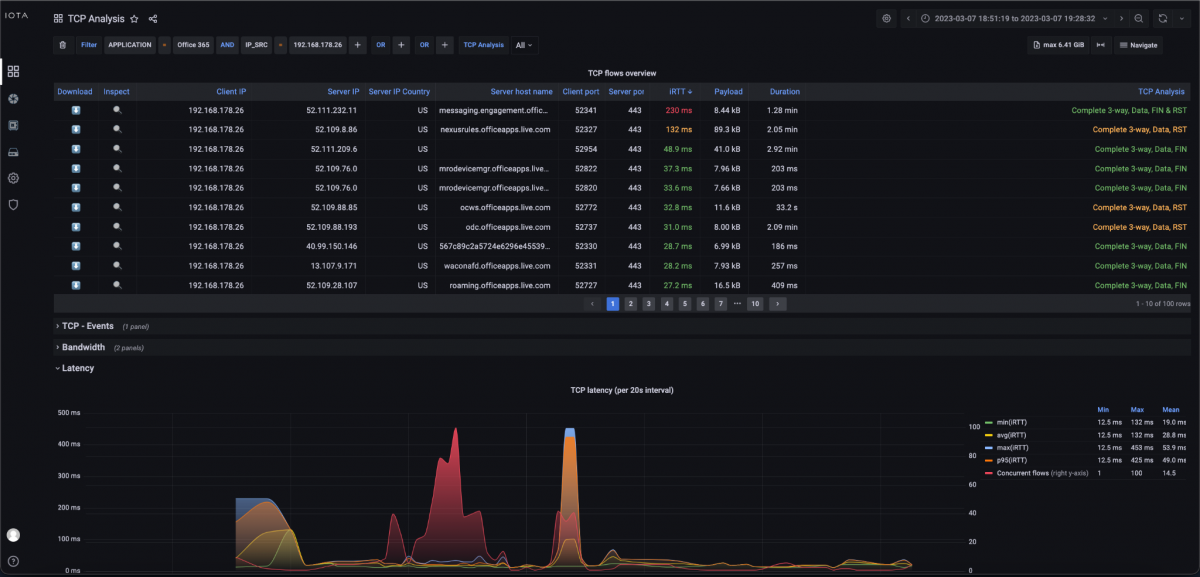
Figure 5: “TCP Analysis” dashboard.
To identify possible bandwidth bottlenecks, bandwidth graphs are available in the TCP Analysis dashboard. These show the total TCP bandwidth used for the data recorded in the interval and a display and listing for each application.
Low bandwidth usage can be caused by missing window scaling flags in the TCP header, for example, or simply by other transmissions that are transported in parallel over the same connection and share the available bandwidth.
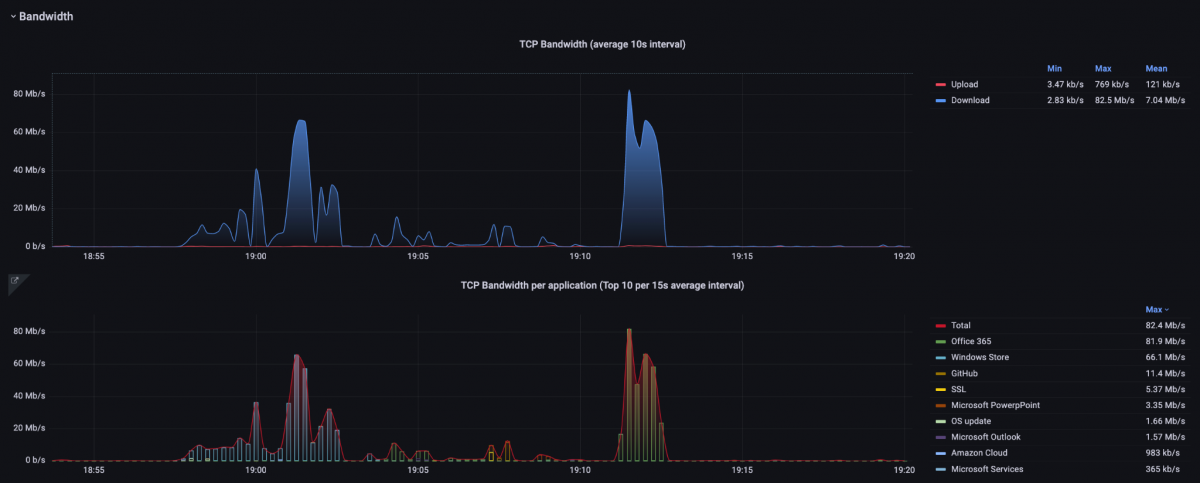
Figure 6: Bandwidth graphs of the “TCP Analysis” dashboard. The upper graph displays the total bandwidth and below the bandwidth per application.
By clicking on the magnifying glass of the corresponding TCP flow (see Figure 5), we can see the corresponding data flow with time, bandwidths, and, in graphical representation, the handshake, data transfer, and decay.
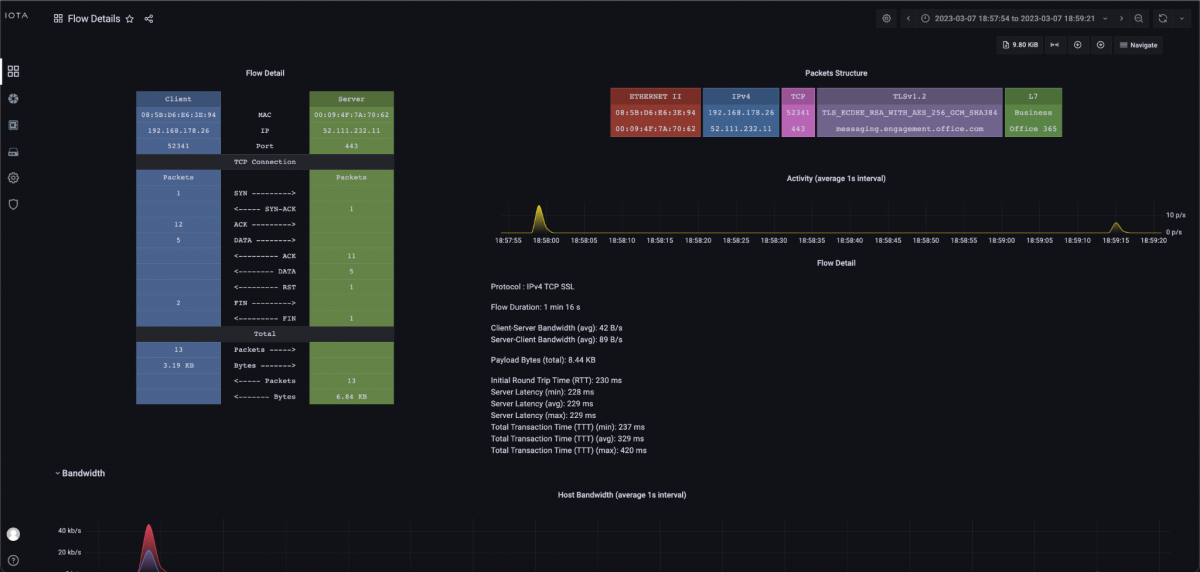
Figure 7: TCP Flow Detail dashboard.
Since, according to the descending list of iRTT in the TCP Analysis dashboard, only this one server has such a high initial round trip time in the specified time window, and other target servers in the same autonomous system from Microsoft are considerably lower, it can be assumed that there is a performance problem bottleneck in the network connection to the server in the Microsoft network or a bottleneck on the server itself. However, since the server latency is roughly in the same range as the iRTT according to the information in the Flow Detail dashboard, it can be assumed that there is a high latency in the connection of this server at Microsoft. This is because when there is a performance bottleneck on the server, the iRTT is usually in the normal range, but the server latency is very high. The behavior shown resulted in a sluggish application.
However, sluggish applications can also have TCP retransmissions due to packet loss or sluggish servers or clients. To evaluate these, we return to the TCP Analysis dashboard.
In this dashboard, we now filter based on the server's destination IP address by hovering over the destination IP address and clicking the + icon to activate the filter.

Figure 8: Creating a filter on the server IP address 52.111.232.11 by clicking the + symbol next to the IP address.
After setting the filter, we look at the TCP Retransmission graph at the bottom of the dashboard. Here, we can see that there were client-side retransmissions in the same time period. This means that the client either did not receive the requested data or acknowledgments (ACKs) or received them late and therefore started a retransmission. An analysis at other points of the communication path would have to provide precise information about where the error originated.

Figure 9: TCP retransmission graph of the filtered connection.
The Application Overview dashboard can also provide a further indication of sluggish applications. In this dashboard, different applications, such as Microsoft Teams in the example shown, can be filtered based on a pie chart and displayed with bandwidth and latency in different graphs and tables.
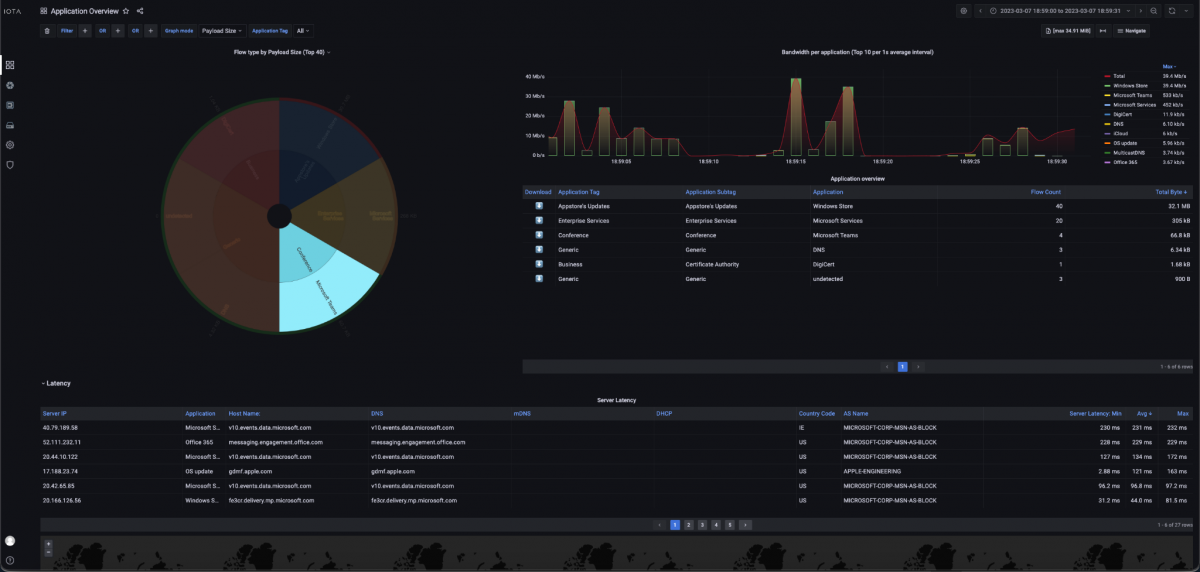
Figure 10: Application Overview dashboard with bandwidth graphs, filtering option based on a pie chart, and a tabular latency overview.
Another error pattern was that the application froze intermittently. A possible cause for a freezing application can be TCP Zero Windows. This means that the packet was delivered on the network side but could not be retrieved by the application from the TCP/IP stack of the operating system. Consequently, the TCP/IP stack signals this to the remote peer. The cause of such behavior is a performance bottleneck at the sender of the Zero Windows. We can then drill down to narrow the scope of the Zero Window message and then filter the flows.
In the Zero Windows plot below, we can see at what times these occurred.

Figure 11: Representation of TCP Zero Window messages.
To detect who sent the Zero Window message, there is then the possibility of a PCAPNG download via the arrow button on the left in the image below.
Using the display filter 'tcp.analysis.zero_window' in Wireshark, it is very easy to determine the sender of the Zero Window.

Figure 12: Download a PCAPNG file for analysis in Wireshark.
About the IOTA solution
The IOTA provides an integrated recording and analysis platform for networks. Based on intuitive dashboards, it is possible to apply performant and diverse filters to determine the root cause of the faulty communication relationship and consequently shorten the mean-time-to-repair. The application intelligence also helps to pre-filter data flows according to the application used.
Learn more about the IOTA solution at profitap.com/iota