Capture management
Capture interfaces
IOTA 100 CORE can capture out-of-band traffic incoming from TAPs, Network Packet Brokers, and switch SPAN ports. The unit features two 40/100G QSFP28 capture interfaces, and can capture 40/100G traffic from both of these interfaces at the same time, or from one interface when using breakout cables for 8 x 10G or 4 x 25G.

The Capture Interfaces tab displays the state and statistics of the capture interfaces.
The Capture Interface Configuration section allows you to set the speed of the capture interfaces, and to enable or disable Forward Error Correction (FEC). Selecting 2x100G or 2x40G will set the speed of both capture ports 1 and 2 to 100G or 40G, and selecting 4x25G or 8x10G will set this speed on capture port 1 and disable capture port 2 (see Interfaces).
The Tunnel Termination Configuration section displays the state of the tunnel termination feature and provides the ability to configure it by clicking the Configure button. This feature allows the device to terminate GRE-TAP (L2GRE), ERSPAN type 2/3 and VXLAN tunnels.
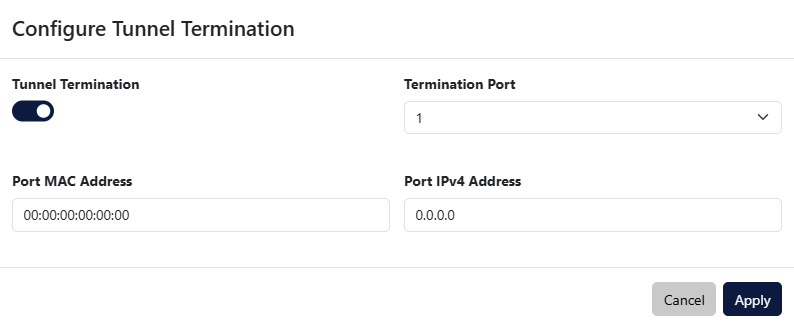
- Tunnel Termination: Enable or disable the tunnel termination feature.
- Termination Port: Select the capture interface on which to enable tunnel termination.
- Port MAC Address: MAC address of the capture interface.
- Port IPv4 Address: IPv4 address of the capture interface.
The PTPv2 Time Synchronization section displays the state of the PTPv2 time synchronization feature and provides the ability to configure the network settings of the interface by clicking the Configure button.
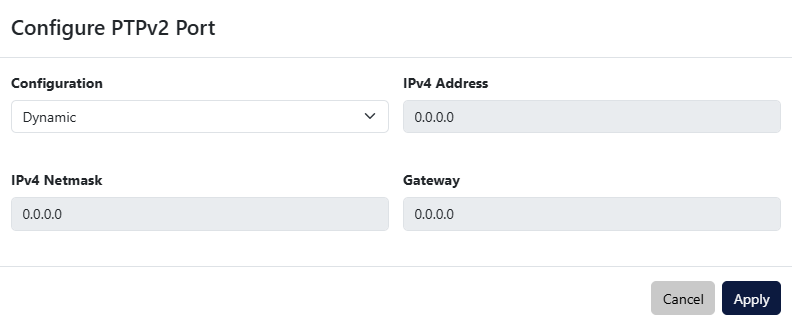
If Configuration is set to Static, the IP address, network mask and gateway can be set manually. If Configuration is set to Dynamic, the PTPv2 interface will attempt to receive network settings from a DHCP server.
Traffic analysis

The Traffic Analysis tab provides controls for the capture and analysis of traffic.
The Analysis Session section displays the capture state and statistics, and allows you to start and stop the capture via the Start Capture/Stop Capture button. The Session Name field allows you to change the name of the capture session. When a capture is in progress, the Session Identifier displays an identifier for the current capture session, based on the start time of the capture.
The use of capture sessions will allow to join traffic incoming from different sources in a single metadata domain, enabling the use of the device at the core of your visibility infrastructure. Metadata on certain analysis dashboards will be able to be filtered based on capture session name and capture session start time.
The Traffic Analysis Settings section allows you to configure the following traffic analysis options:
- Flows Time Sampling Period: Sampling period used to create traffic metadata entries in the device storage. Lower values allow more detailed traffic analysis but it will increase storage usage.
- VLAN/MPLS Correlation: If enabled, VLAN tags and MPLS labels will be used to identify traffic flows. If disabled, they will be ignored.
- Packet Re-ordering: Enabling TCP packets reordering will improve application detection but it may impact traffic timing and metrics evaluation.
- TCP Performance Analysis: When enabled, the analysis engine will generate TCP performance metrics. This may impact analysis performance.
- DNS Performance Analysis: When enabled, the analysis engine will generate DNS performance metrics. This may impact analysis performance.
- HTTP Performance Analysis: When enabled, the analysis engine will generate HTTP performance metrics. This may impact analysis performance.
The Hostnames, Host Groups and Custom Applications sections allow you to define custom resolutions to be displayed in the analysis dashboards.
- Hostnames: Resolves singular IP addresses to a hostname.
- Host Groups: Tags any IP address within a subnet with the specified group name.
- Custom Applications: Tags flows matching a destination IP, protocol and port number with the specified application name.
Note: Hostnames and Host Groups are resolved at query time (i.e. when using the analysis dashboards), while Custom Applications are resolved at analysis time (i.e. when the traffic is first analyzed).
Data storage

The Data Storage tab provides controls for the filtering and storage of captured traffic.
Storage management
The Storage Management section allows you to define the allocation of storage for Metadata (extracted from captured traffic) and Packet Capture (raw captured data), and to control the cleanup of stored data.
Click and drag the slider to change the storage allocation. The used and total allocated storage for metadata and for packet capture are displayed below the slider, on the left and right respectively. Further below, a time estimation of the available storage when capturing is displayed when available.
The cleanup of previously captured data is done by defining a start time and end time for the data to delete, then clicking the Delete Metadata button to remove metadata extracted from captured traffic, the Delete Packet Capture button to remove raw captured data, or the Delete All Data button to remove both.
Packet capture statistics
The Packet Capture Statistics section provides statistics about the packet capture, with Stored Packets referring to packets allowed to be captured by the defined filters, Removed Packets to packets filtered out, and Dropped Packets packets dropped by the capture interfaces. The Reset Statistics button resets these statistics.
Packet capture filters
The Packet Capture Filters section allows you to define filters for the packet capture.

The Default Policy can be set to allow or drop. Each filter has its own policy, and can be set as either an allow or drop filter, to capture or filter out traffic matching that filter. Setting the Default Policy to allow will capture all traffic by default, in which case drop filters can be used to filter out specific traffic. Setting the Default Policy to drop will not capture any traffic by default, in which case allow filters should be defined to capture specific traffic.
Filter priority can be defined on the filter window, or by clicking the up and down arrows in the list of filters, with a lower number corresponding to a higher priority. This can be used to create exception cases within drop or allow filters.

The possible filtering options are as follows:
- Ethernet Layer
Only frames matching MAC details configured in this section will be targeted (Source/Destination MAC Address, Source/Destination MAC Mask), with the possibility to select the Packet Type (ARP, IPv4, IPv6, TCP (IPv4/6), UDP (IPv4/6), SCTP (IPv4/6), Custom Protocol (IPv4/6), or any). - IPv4/IPv6 Layer
When IPv4/IPv6 is selected, the system will filter for any packet of those types. In order to filter for the IPv4/IPv6 details, the user needs to fill in the related fields (Source/Destination IP Address, Source/Destination IP Mask). The Protocol setting is only configurable for IPv4/IPv6, allowing the user to restrict the traffic to a specific type of L4 header (TCP, UDP, SCTP, ICMP, IGMP). Any allows entering a custom protocol value or setting no filter for L3 headers. - TCP/UDP/SCTP Layer
When TCP/UDP/SCTP is selected in Packet Type or Protocol, a range of source and destination ports can be defined in this section. - VLAN Tags
Can be used for filtering on outer/inner VLAN by defining a range of inner and outer VLAN IDs. Both ranges cannot overlap.