Table of Contents
ProfiShark Manager User Guide
1. Getting started
The ProfiShark Manager is the application that drives every ProfiShark: it shows the links, runs captures, configures the hardware features, generates traffic on the 10G models, and keeps each unit's firmware up to date. It runs on Windows, Linux and macOS, in English, French, German, Spanish, Simplified Chinese and Japanese. A command line built on the same core does everything the pages do, for scripts.
Reading this manual. Each page of the Manager has its own section in part 3, in the order of the menu, with what it is for, which ProfiShark models show it, a screenshot, and every control it has. Tags such as 10G or all models say which models a feature applies to; new marks what was added from July to October 2026. Menu paths are written Menu › Item.
1.1 Install
Windows
Run Profishark-<version>.exe. It installs the Manager, the ProfiShark driver (signed by Microsoft), the library, the command line, and the driver of the USB boot loader used for firmware recovery.
The file is available from the ProfiShark repository.
Linux
Install the Manager package (.deb for amd64 or arm64, or the Flatpak), then the driver for your distribution and kernel: per-kernel packages for Debian 11–13, Ubuntu 22.04–26.04 and Kali, or the DKMS package (.deb, .rpm) that rebuilds itself for every new kernel. The packages are also on the Profitap APT repository.
For more information, see ProfiShark software setup - Linux.
macOS
Open ProfiShark-<version>.pkg (Apple silicon). At the end, ProfiShark Driver opens: click Install, then allow the extension in System Settings › Privacy & Security. A Mac that had the old kernel extension has it removed first.
The file is available from the ProfiShark repository.
1.2 First steps
- Plug the ProfiShark into a USB 3 port. A tab appears at the top of the Manager with the unit's model, its mode (CAP or GEN) and its name.
- If the Manager needs a newer firmware in the unit, only the Device page is shown: update from there (part 4).
- On Home, install the Wireshark pieces if you use Wireshark (part 5).
- Press Start Capture in the device header to record with the settings of the Capture page, or open a page from the menu on the left.
1.3 How the controls behave
| Control | Behaviour |
|---|---|
| Toggle switch | Every on/off setting is a switch. On a settings row, a click anywhere on the row flips its switch, except on another control of that row. |
| ? bubble | Hover it for a short explanation. Any control or reading with a tooltip shows it after a short hover. |
| Numbers and sliders | The mouse wheel steps the field or slider under the pointer, within its limits. |
| Save, Save to device | Settings apply to the ProfiShark at once; Save writes them into the unit so they survive a power cycle. The button is highlighted while what runs differs from what is saved, and goes back to normal once they match. |
| Set (Filters) | Applies a filter now; highlighted while the screen differs from what the ProfiShark applies. |
| Foldable card ▾ | Click the card's heading to fold it. A folded chart keeps recording. |
| Dialogs | Enter confirms, Esc or a click outside cancels. A destructive confirmation is red. |
| Zoom | Ctrl++ / Ctrl+- enlarge or shrink the whole window, Ctrl+0 goes back to 100 % (Cmd on macOS). |
The pages keep running. A unit's pages exist from the moment it is plugged in and keep collecting history (charts, counters, logs) whether they are on screen or not.
2. The application window
What it is for
Watch and drive every ProfiShark from one window: see at a glance which unit is capturing or sending, switch between units without losing your place, and read a whole day of measurements without having kept the page open.
2.1 The tab row

The tab row: Home, a ProfiShark 10G in generator mode (GEN), a ProfiShark 10G+ capturing (CAP, green), Batch control and Report.
From left to right:
| Element | What it does |
|---|---|
| Home | Opens the Home screen (section 2.2). |
| One tab per ProfiShark | Model plate (1G, 1G+, 10G, 10G+, 100M, SPE), mode plate and name (the alias, or the MAC address). Hover for the model and its firmware versions. A click opens the unit on the page you last had open on it. new |
| Batch control | Starts or stops several ProfiSharks together (section 3.11). |
| Report | Shown while a unit is open: This page or Every page, as PDF or HTML (section 2.7). |
The mode plate new tells what the unit is doing:
| Plate | Meaning |
|---|---|
| CAP, blue | Capture firmware, not capturing. Every 1G-family unit and the SPE are always CAP. |
| CAP, green | Capturing: in the Manager, or in another program (Wireshark through the capture plugin). |
| GEN, blue | 10G family on its generator firmware, not sending. |
| GEN, orange | Generating traffic. |
In a narrow window the row wraps onto a second line. While a firmware update writes to a unit, the tabs are locked until the write ends.
2.2 Home
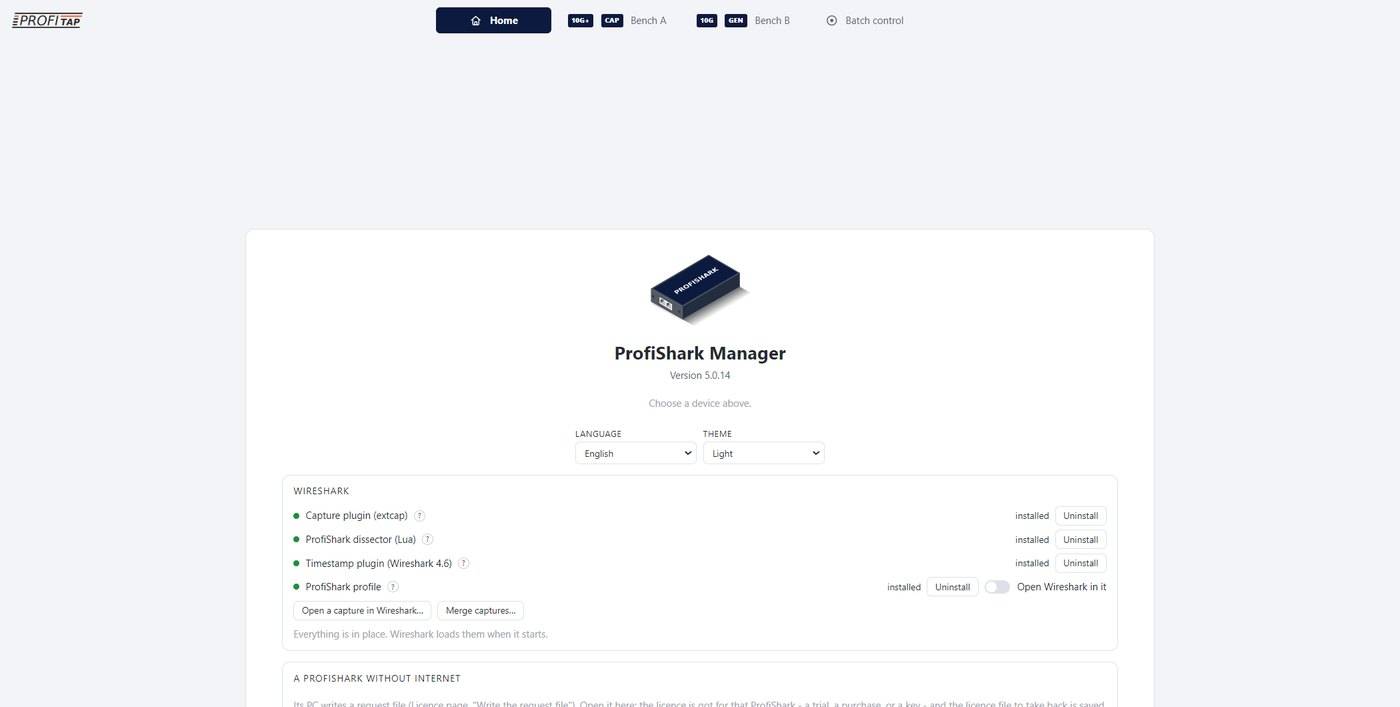
The Home screen: version, language and theme, the Wireshark card and the licence-request card for ProfiSharks on a computer without Internet.
- Version of the Manager, and a hint: “Choose a device above”, “Connect a ProfiShark to begin”, or why the ProfiShark library or driver is not answering (with what to reinstall).
- Language: English, Français, Deutsch, Español, 简体中文 (Simplified Chinese), 日本語 (Japanese) new. The window redraws in the new language on the same unit and page.
- Theme: Auto (follows the desktop), Light, Dark.
- Wireshark card: install, update or uninstall the four Wireshark pieces, Open a capture in Wireshark… and Merge captures… (part 5).
- A ProfiShark without Internet: Open a request file… answers the licence request of a ProfiShark whose computer has no Internet (section 3.15).
- Footer: Profitap's address and Third-party notices.
2.3 The device header
- Name and the pencil Rename device: type an alias (“rack 3, uplink”), Enter to keep it, Esc to cancel; an empty name goes back to the MAC address. The alias shows on the tab, in Batch control, in reports and in the Manager's capture files (section 2.8).
- Model line.
- Link chips: green dot when up, red when down. In SPAN mode one chip per port (“Port A · 10 Gb/s”), inline a single “Link” chip.
- The big button:
- Start Capture / Stop Capture on a unit in capture mode: records with the settings of the Capture page, even if that page was never opened.
- Start Generator / Stop Generator on a 10G in generator mode: sends what the Packet Generator page holds.
- Greyed with a reason when the unit needs a firmware update (“Update the device first: see the Device page.”), when the generator is not in the licence, or while a firmware update writes.
2.4 The menu (rail)
- The pages of the selected unit, in this order, each shown only where the unit has it: Dashboard, Packet Statistics, Microbursts, Ports, Tunnel, Cable Tester, Packet Generator, Link Scope, Filters, Capture, Logs, Timing, Device, Licence. Part 3 describes them one by one.
- The arrow at the top narrows the menu to its icons (the titles become tooltips) or widens it again.
- The language picker sits at the foot of the menu.
- When the unit needs a firmware update, the menu shows only Device.
The dots beside the page titles
new
A small dot after a page's title in the menu tells you about that page while you are on another one. Hover the dot for the reason.
| Dot | Means | Goes away |
|---|---|---|
| Blue | Something of that page is active right now. | When the activity stops. Opening the page does not clear it. |
| Red | Something happened there that you have not seen yet. | When you open the page. A red that happens while the page is on screen is not raised: you saw it. |
A red dot covers the blue one; once it is cleared, the blue shows again if the page is still active.
| Page | Blue while | Red when |
|---|---|---|
| Packet Statistics | — | damaged (invalid) frames were received |
| Microbursts | a port is being watched | bursts were recorded |
| Ports | a module was plugged or unplugged (until you look) | both ports are down |
| Tunnel | a port answers as a tunnel endpoint | — |
| Packet Generator | the generator is sending | — |
| Link Scope | an eye scan is running, or a finished scan has not been looked at | — |
| Filters | a filter is set: packet types not captured, a field filter or a pattern filter (the tooltip lists them) | — |
| Capture | a capture is recording, from the Manager or from another program (Wireshark) | frames were dropped during the capture |
| Logs | new lines arrived in the log (until you read them) | — |
| Timing | the GPS sees satellites, a PPS is coming in, or both | — |
After a restart. When the open unit leaves the bus (firmware update, switch, restart) the window goes to Home. If the same unit comes back within two minutes and you have not clicked elsewhere, the Manager returns to it, on the same page.
2.5 History charts
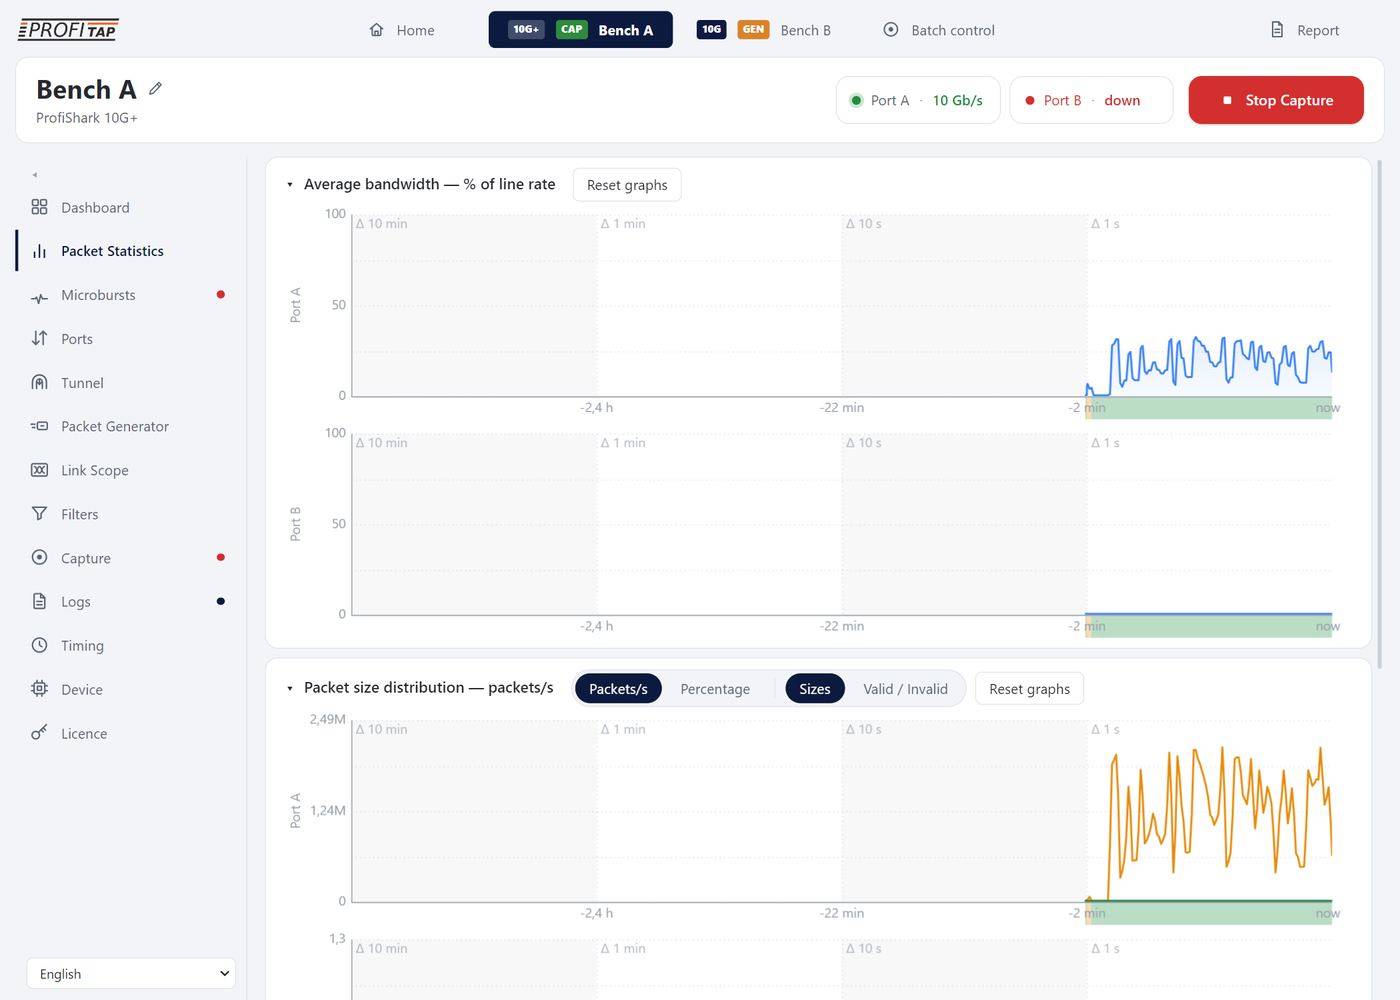
Packet Statistics on a ProfiShark 10G+ while it captures: the bandwidth history of port A and port B on the 24-hour axis.
- Every history chart shows the whole history on one compressed time axis: the last 2 minutes at 1 s per point, then 20 minutes at 10 s, 2 hours at 1 min and 20 hours at 10 min. Alternating shading separates the segments; now is at the right edge.
- Hover a chart: a crosshair snaps to the nearest sample and a readout shows its time and every series. The charts of the same port on a page share the crosshair, so a burst is read against the load at the same instant.
- Reset graphs throws away the history the graphs are drawn from; the ProfiShark's counters are not touched.
2.6 The capture strip
new
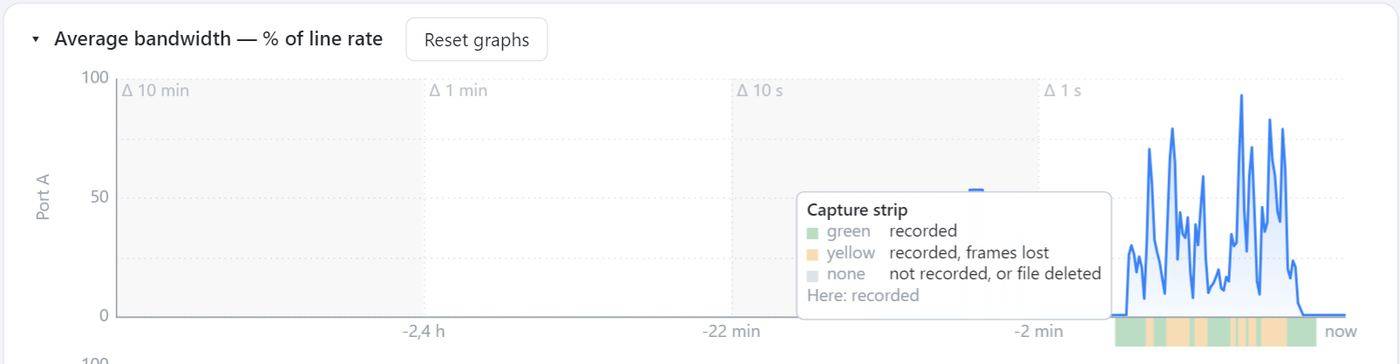
A ProfiShark 10G+ capturing generated traffic that changes load every second (5 to 95 % of the link, packet slicing on): the strip is green where every frame was recorded and yellow in the seconds the unit had to drop. Hovering the strip shows what the colours mean.
Under the time axis of the Packet Statistics and Microbursts charts, a translucent band says, second by second, whether the ProfiShark was capturing:
- Green (recorded): captured, no frame dropped in that second.
- Yellow (recorded, frames lost): captured, the drop count grew in that second.
- Nothing (not recorded): not capturing, or the file that held those seconds no longer exists.
It covers the Manager's captures and another program's (Wireshark), on every ProfiShark. Hover it for a tooltip with the colours and the state at that point. For a Manager capture the strip stays green only where a capture file still exists: when the ring buffer deletes its oldest file, the seconds it held lose their colour.
Each port's chart has its own strip. When Disable Port A or Disable Port B is on, nothing from that port reaches the capture, so that port's strip stays empty while the other one fills.
The chart's own tooltip, under the pointer, ends with a Capture row: recorded, recorded, frames lost or not recorded for the moment the pointer is on. Its swatch is the strip's colour. The charts that only follow the shared crosshair do not show this row.
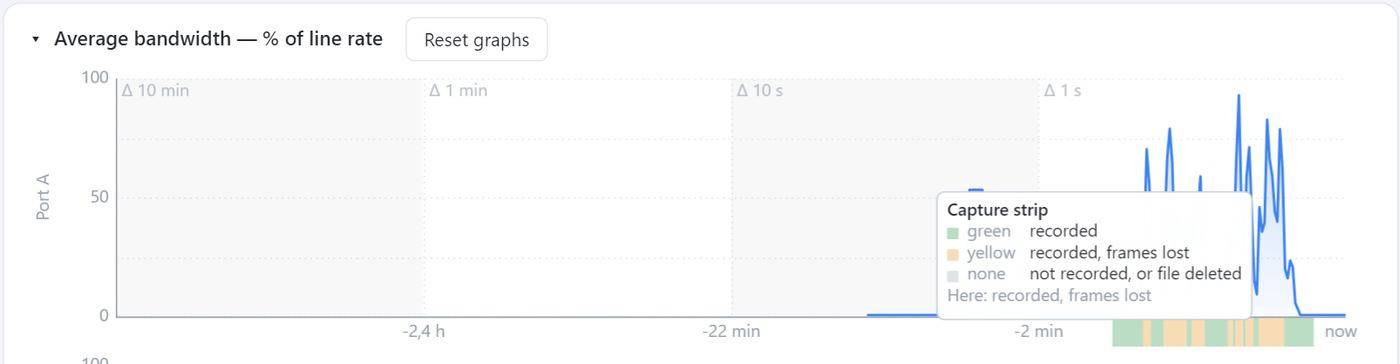
The same strip hovered over a yellow second: “Here: recorded, frames lost”.
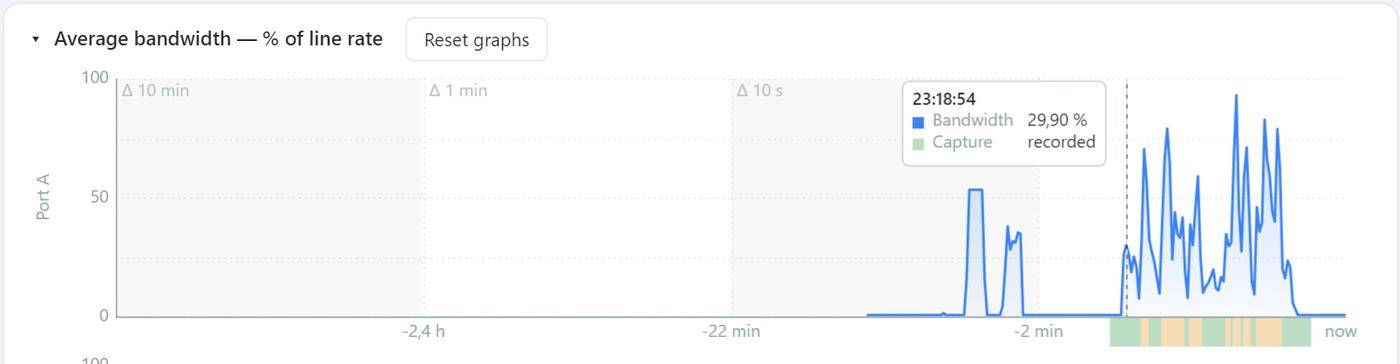
The chart tooltip at 29.90 % of the link: the Capture row says that second was recorded in full.
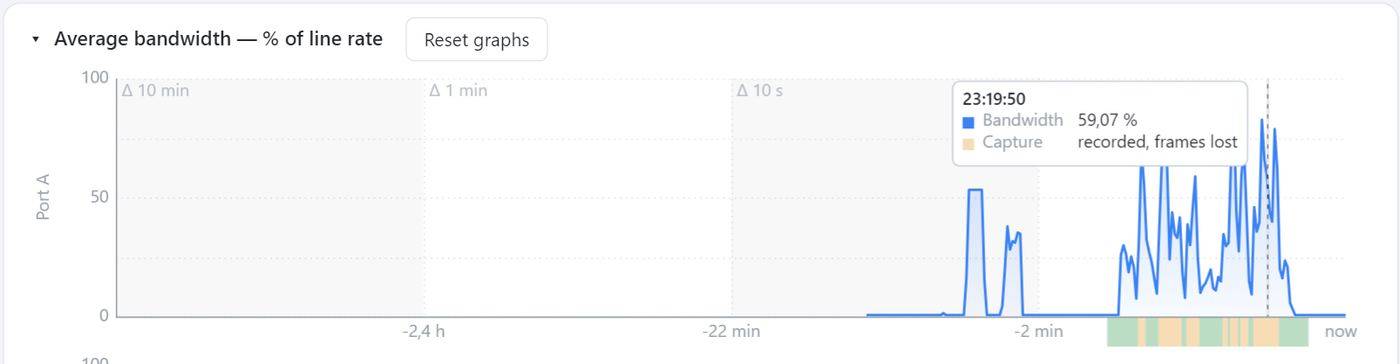
At 59.07 % of the link the Capture row says frames were lost: more than the USB link carries, even sliced.
2.7 Reports
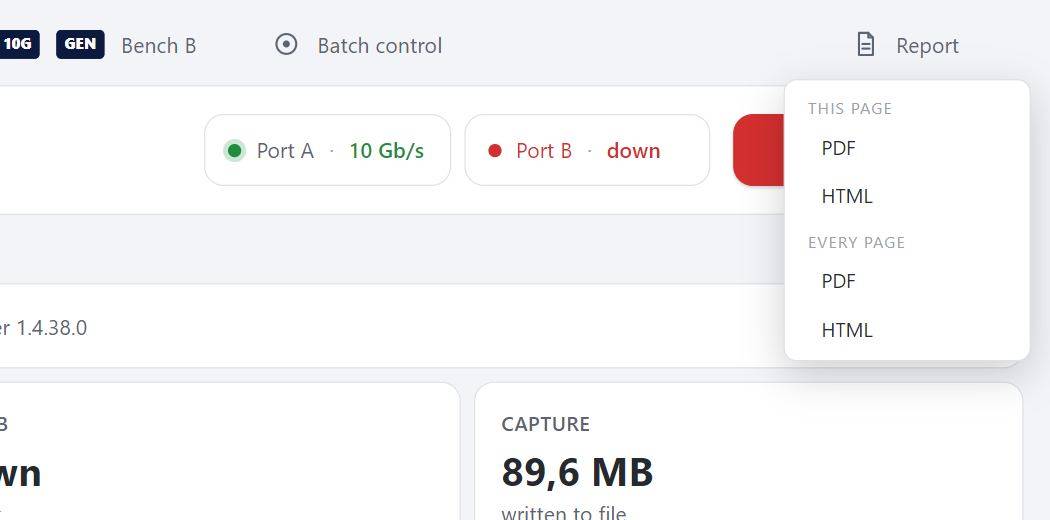
The Report menu: this page or every page, as PDF or HTML.
Report turns what the pages know into a document: This page or Every page, as PDF or HTML (one self-contained file). A save dialog asks where to write it; the button reads “Working…”, “Saving…” and “Saved”. Thirteen pages contribute: facts in two columns, tables with their units, and the charts redrawn at full width with clock time on the axis, with a cover sheet naming the unit and the moment. Nothing has to be on screen.
2.8 Names: the alias, the Windows connection, the Wireshark interface
A ProfiShark is known by several names. They serve different readers, and each is set in its own place.
| Name | Example | Where it shows | Where it is set |
|---|---|---|---|
| MAC address | 00:00:5e:00:53:0c | Everywhere, when there is no alias | Fixed: the unit's identity, written at the factory |
| Alias | rack 3, uplink | The Manager's tab, the device header, Batch control, reports, and the hardware description of the capture files the Manager writes | The pencil beside the name in the device header |
| Windows network connection | ProfiShark 1G+ 00-00-5e-00-53-0c | Network connections (ncpa.cpl), Windows settings, Wireshark's interface list for a live capture on the ProfiShark's network adapter | By the driver when the adapter starts; Device page › Network interface › Rename |
| Adapter description | ProfiShark, ProfiShark 10G | Device Manager, Wireshark's interface details | The driver's INF, by USB product id (not changeable) |
| Capture plugin interface | ProfiShark 1G+ (00:00:5e:00:53:0c) | Wireshark's interface list, for a capture through the capture plugin | The capture plugin, from the model and MAC |
In this manual's screenshots the units carry the aliases Bench A to Bench D, and their MAC addresses are replaced by documentation addresses (00:00:5E:00:53:xx, reserved for examples by RFC 7042).
The alias
- Click the pencil beside the name, type the alias, Enter to keep it, Esc to cancel. An empty alias goes back to the MAC address.
- It is kept on this computer, by MAC address, and survives restarts of the Manager; on another computer, give it again. The Manager writes it into the hardware description of its capture files, so a file still says “rack 3, uplink” a year later.
The Windows connection name
- Windows names every network connection “Ethernet 14” and the like, which says nothing about which ProfiShark it is. The ProfiShark driver names its connection itself when the adapter starts: model and MAC address, e.g. “ProfiShark 10G+ 00-00-5e-00-53-0a”, so two units of the same model never collide.
- It replaces only a name Windows generated, or a name of its own form that no longer matches the unit (another model or another address, which happens when units share an adapter slot). A name you chose is never touched.
- Device page › Network interface: the name the connection carries now, with a ✓ when Windows confirms it (or “disabled” / “disconnected”). Rename to choose another one: Default name fills in the driver's name, Apply renames (Windows asks for administrator rights), Cancel. The rename takes effect at once — Wireshark lists the new name without a restart — and does not interrupt a running capture. Windows refuses \ / : * ? “ < > | in a name and two connections with the same name.
In Wireshark
- Through the capture plugin (the usual way, part 5): the interface is listed as the ProfiShark with its model and MAC, with the unit's own capture options.
- On the ProfiShark's network adapter (Windows): the interface carries the Windows connection name above; turn on Enable timestamps in live capture and install the timestamp plugin to get the hardware time.
- In a capture file, the alias, model and MAC are in the file's section header, and each port has its own interface (port A, port B).
3. The pages, one by one
In the order of the menu. Each page says what it is for, which ProfiSharks have it, and what every control does.
| Page | Shown on | Licence (10G family) |
|---|---|---|
| Dashboard | every unit | — |
| Packet Statistics | units with statistics counters (100M, 1G and 10G families, SPE) | — |
| Microbursts | 10G, 10G+ in capture mode | Microburst detector |
| Ports | 10G, 10G+ (SFP); the 1G family and the SPE have their own version; not on the 100M | — |
| Tunnel | 10G, 10G+ in capture mode | Tunnel termination |
| Cable Tester | 1G v6, 1G v7, 1G+, SPE | — |
| Packet Generator | 10G, 10G+ in generator mode; 1G family and SPE (PHY generator) | Packet generator (10G) |
| Link Scope | 10G, 10G+ in capture mode | Link Scope |
| Filters | 10G, 10G+ in capture mode (and the other units with hardware filters) | — |
| Capture | every unit except a 10G in generator mode | — |
| Logs | every unit | — |
| Timing | units with the GPS/PPS timing board (10G+, 1G+) | — |
| Device | every unit, always | — |
| Licence | 10G, 10G+ | — |
Which pages each ProfiShark has
As shown by the units on our bench; each page appears only where the unit has the hardware for it.
| Page | 10G, 10G+ capture | 10G, 10G+ generator | 1G+ | 1G v6, v7 | SPE | 100M |
|---|---|---|---|---|---|---|
| Dashboard, Packet Statistics, Logs, Device | ✓ | ✓ | ✓ | ✓ | ✓ | ✓ |
| Ports | ✓ | ✓ | ✓ | ✓ | ✓ | — |
| Microbursts, Tunnel, Link Scope, Filters | ✓ | — | — | — | — | — |
| Capture | ✓ | — | ✓ | ✓ | ✓ | ✓ |
| Packet Generator | (firmware card) | ✓ (10G generator) | ✓ (PHY generator) | ✓ (PHY generator) | ✓ (PHY generator) | — |
| Cable Tester | — | — | ✓ | ✓ | ✓ | — |
| Timing | 10G+ (GPS) | 10G+ (GPS) | ✓ (GPS) | — | — | — |
| Licence | ✓ | ✓ | — | — | — | — |
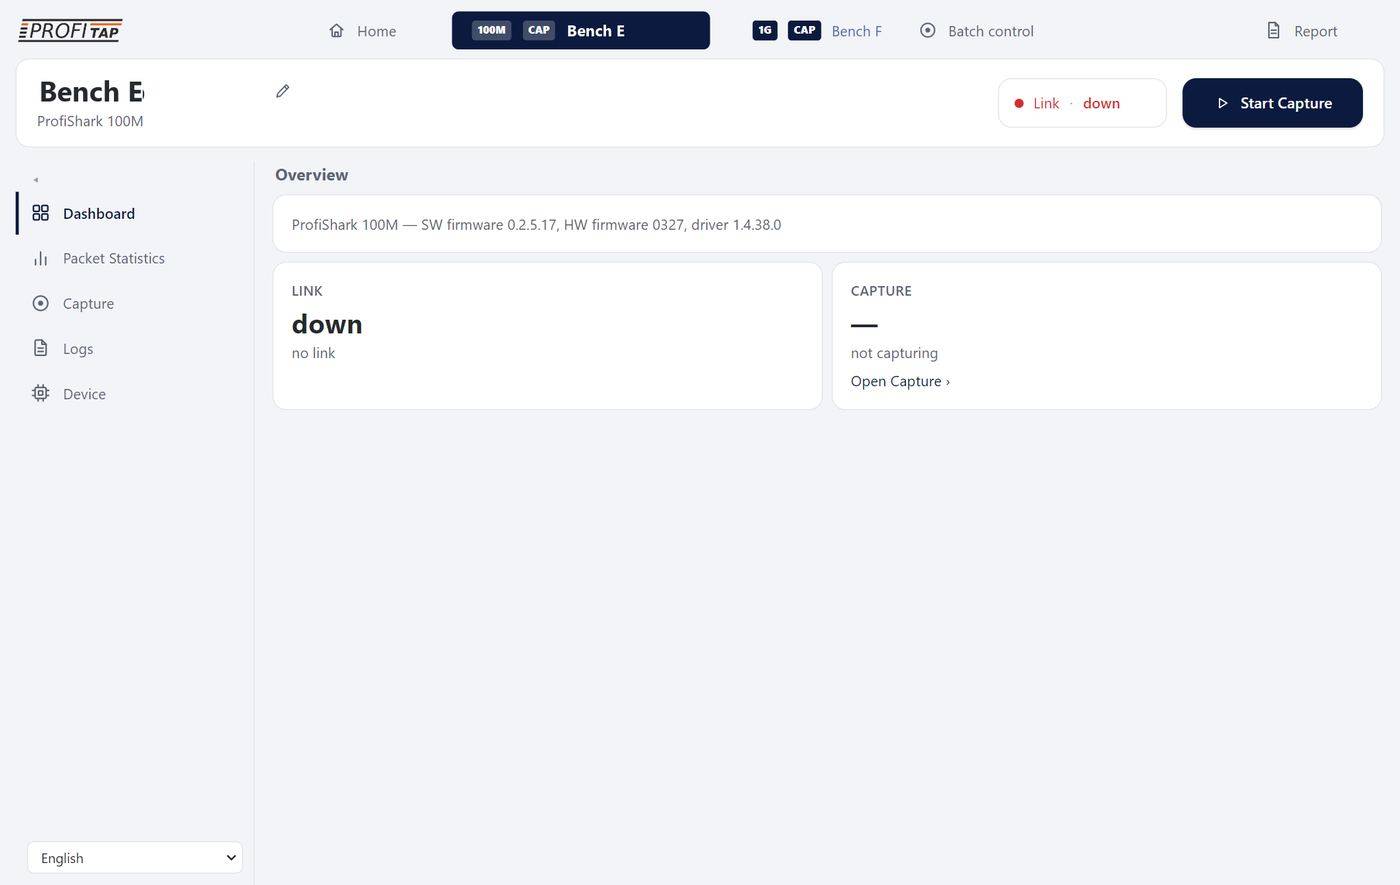
A ProfiShark 100M: five pages - Dashboard, Packet Statistics, Capture, Logs and Device. Its ports negotiate on their own, so there is no Ports page.
Without the licence a licensed page stays visible, with a card on top: ”feature: not included in this ProfiShark's licence“, the reason (no licence, expired on a date, licensing server not reached for too long, suspended, not in the plan) and Open the Licence page. Its controls are locked. Capture, filters, statistics and timestamps never need a licence.
3.1 Dashboard
What it is for
The page a ProfiShark opens on: is the link up, at what speed, and what is the unit doing right now.
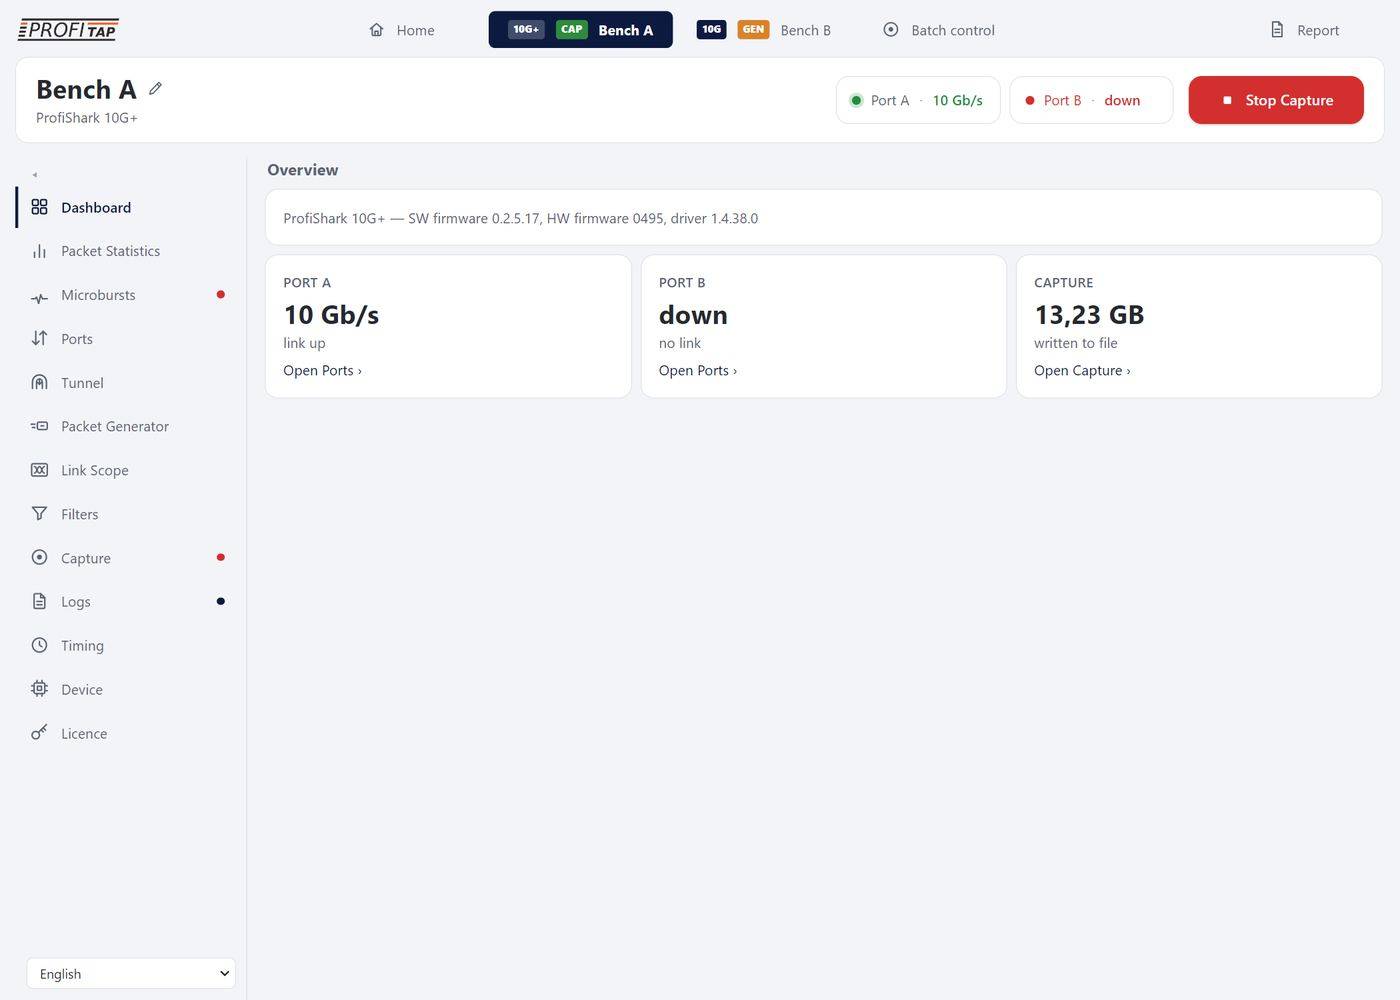
The Dashboard of a ProfiShark 10G+: identity line, port A at 10 Gb/s, port B down, and the capture with the bytes written.
- Identity: model, SW firmware, HW firmware and driver versions.
- PORT A / PORT B (SPAN mode) or LINK (inline: time up and length of the last outage): the link speed, or “down”.
- CAPTURE (capture mode): bytes written to file, or “not capturing”. GENERATOR (generator mode): packets generated, stopped or running with its packet rate.
- Links Open Ports ›, Open Capture ›, Open Packet Generator ›.
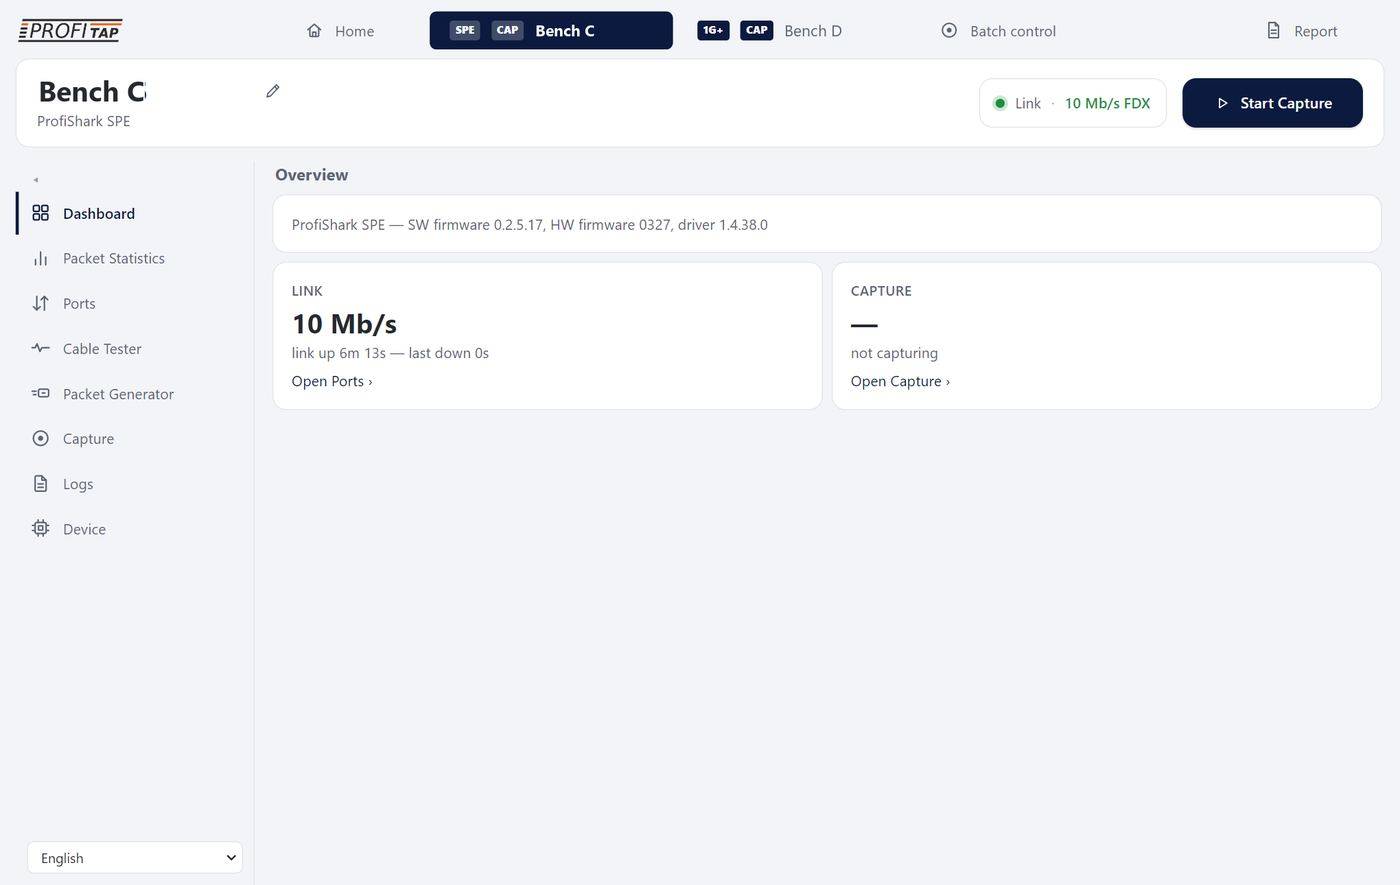
The Dashboard of a ProfiShark SPE inline on a 10BASE-T1L link: one LINK card at 10 Mb/s with the time it has been up, and the capture.
3.2 Packet Statistics
What it is for
How much traffic each port carries and what it is made of — load against the line rate, frame sizes, good and damaged frames — measured by the ProfiShark's own hardware counters, whether or not anything is being captured.
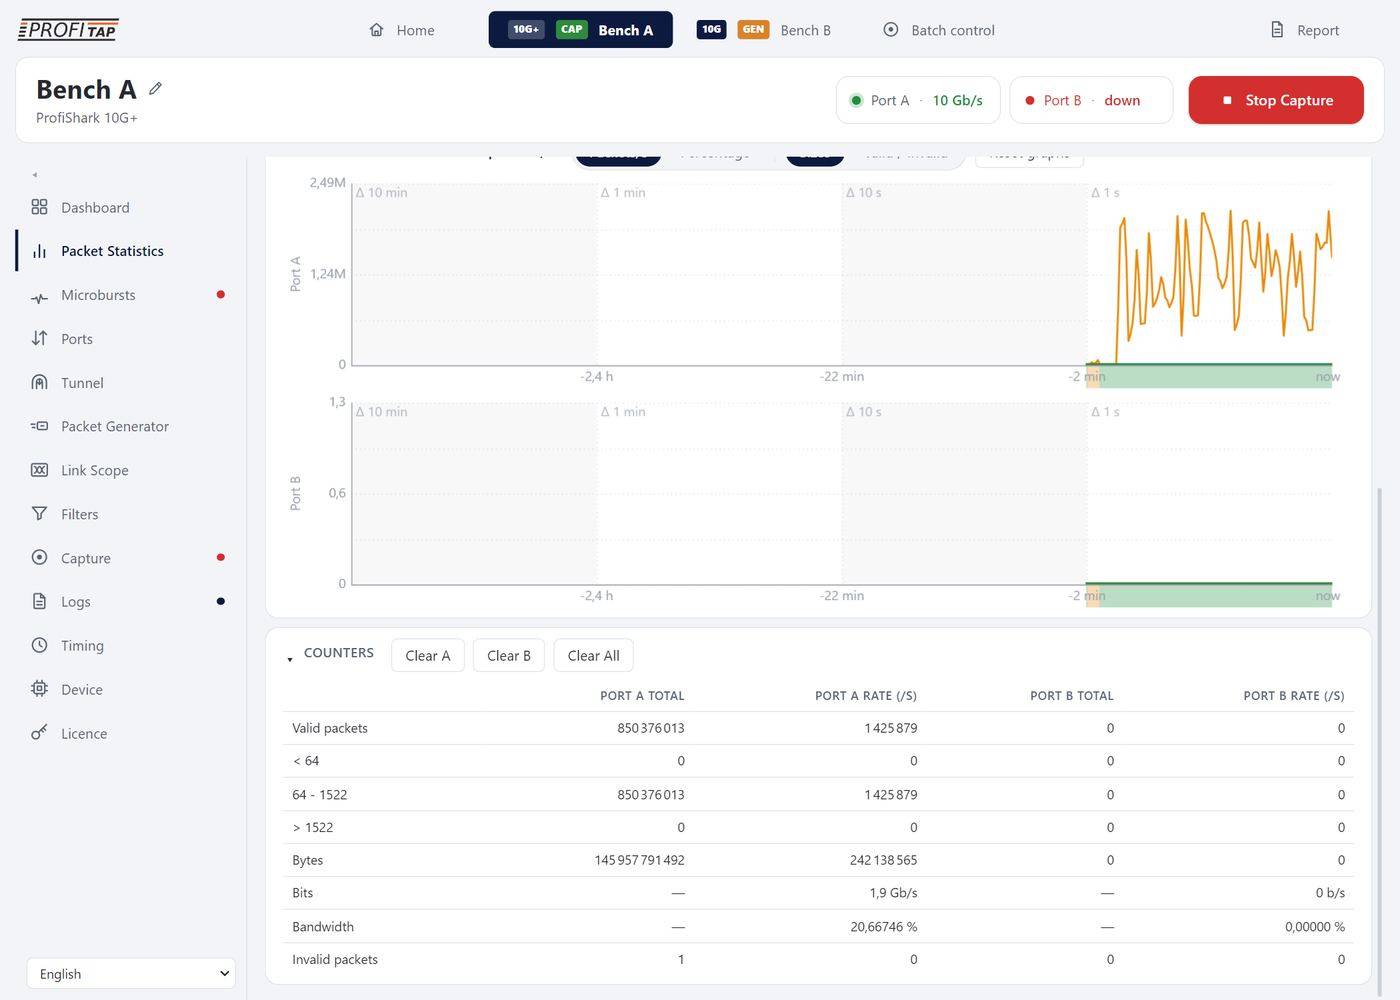
Packet Statistics, further down: the size distribution charts and the Counters table of both ports.
Where the figures come from
- The ProfiShark counts every frame of each port in hardware, captured or not: valid frames, invalid frames (bad FCS), bytes, frames under 64 bytes and over 1518 bytes. The Manager reads the counters once a second.
- A rate is the difference between two readings divided by the exact time between them. On the 10G family the counters are latched by the FPGA and stamped with its own nanosecond clock new, so the interval is exact and a link at line rate reads 100 %; on the other models the computer's read instant is used.
- The rate is always against the port's actual speed: a port negotiated at 1 Gb/s is measured against 1 Gb/s, not 10.
Average bandwidth — % of line rate
One chart per port: the share of the line the traffic occupied in each second, 0–100 %. The occupancy counts the wire, not only the frames: each frame's bytes plus its 8-byte preamble and the 12-byte minimum gap. When the microburst detector watches the port, its wire-byte counter is used instead — byte for byte, including the real gaps of the 10G encoding — so the figure is exact for any frame size. Very small loads show two significant figures rather than 0.00 %.
Packet size distribution — unit / Valid / invalid — unit
| Choice | Shows |
|---|---|
| Sizes, Packets/s | Valid frames per second in three classes: < 64 (runts that passed the FCS), 64 - 1518 (standard Ethernet), > 1518 (VLAN-tagged maxima and jumbo frames). |
| Sizes, Percentage | The same three classes as shares of the valid frames, stacked to 100 %: the traffic mix at a glance. |
| Valid / Invalid, Packets/s | Good and damaged frames per second on a logarithmic axis, so ten bad frames remain visible next to a million good ones. The Invalid line is drawn only where there were some. |
| Valid / Invalid, Percentage | The share of damaged frames: a cable or optic problem shows as a steady few per million. |
Both units are recorded all the time; switching loses no history. Reset graphs empties every chart of the page (the counters are untouched).
Counters
| Row | Total | Rate (/s) |
|---|---|---|
| Valid packets | Frames received with a correct FCS | per second |
| < 64, 64 - 1522, > 1522 | Valid frames by size | per second |
| Bytes | Bytes of the valid frames | per second |
| Bits | — | b/s, kb/s, Mb/s, Gb/s |
| Bandwidth | — | % of line rate, five decimals |
| Invalid packets | Frames received with a bad FCS (damaged on the wire, or cut short) | per second |
Clear A, Clear B and Clear All restart the totals of the page from zero (“since the last Clear”); the ProfiShark's hardware counters keep counting. The menu dot turns red when a port received invalid frames while you were on another page.
Statistics in capture files. The same per-port counts travel inside every capture file (section 3.10), so a file says afterwards what the link carried and what the ProfiShark lost.
3.3 Microbursts
10G10G+new
What it is for
Find the short bursts that overflow a switch buffer for a few hundred microseconds and cause losses no per-second graph shows, and name the sender that caused them. The FPGA watches every frame of each port, with nothing to configure.
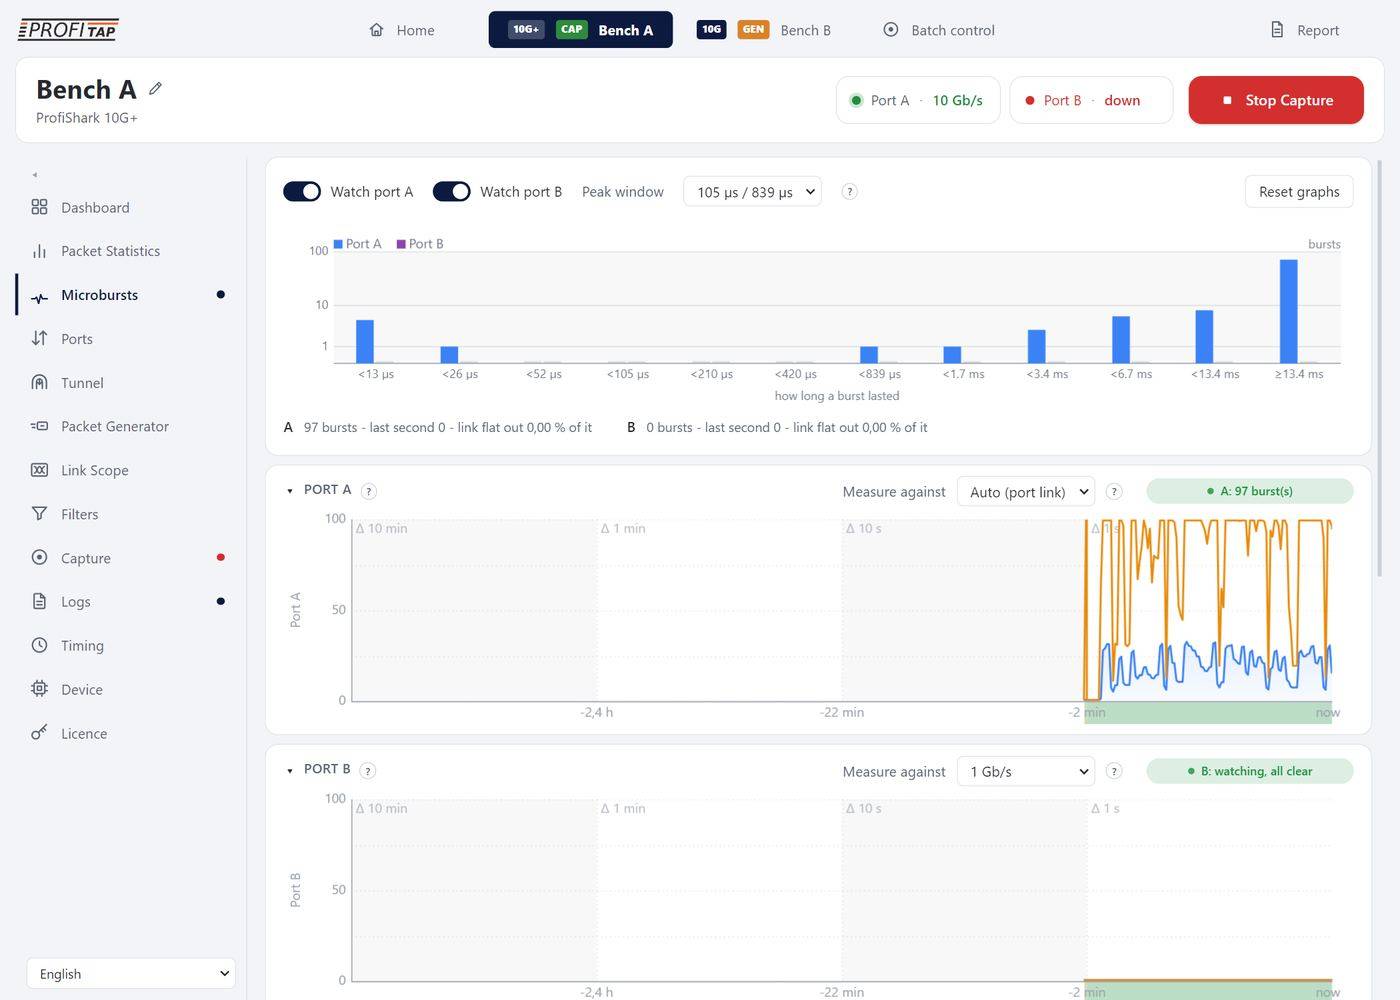
The top of the Microbursts page during a test: Watch port A and B, the peak window, the burst-duration histogram, and the port A card with its state chip.
Top card
- Watch port A / Watch port B: start or stop the detector of a port. Turning a port off also empties its graphs and event marks. The menu dot is blue while a port is watched.
- Peak window: 13 µs, 105 µs (default) or 839 µs at 10 Gb/s (105 µs, 839 µs, 6.7 ms at 1 Gb/s): the window over which the yellow peak line is measured. All three are measured at once; the choice only picks which is drawn.
- Reset graphs: empties the histogram, timelines and gap charts (the Senders table is kept).
- The burst-duration histogram: twelve classes from <13 µs to ≥13.4 ms, both ports, logarithmic. Hover a class for its counts.
- A summary line per port: bursts so far, bursts in the last second, and the share of that second the link was flat out.
PORT A / PORT B
- A history chart: the blue area is the bandwidth over each second, the yellow line the peak over the chosen window; the gap between them is the burstiness. Red marks show the moments of the senders or events selected in the table.
- Measure against: Auto (port link) or 1 Gb/s. Choose 1 Gb/s when a 1 Gb/s link reaches this port through a 10 Gb/s mirror, otherwise nothing ever looks busy. Every figure follows; the link itself is not touched.
- State chip: not watching, watching all clear, n bursts, or saturated right now (red).
INTER-FRAME GAP - PORT A / PORT B
Each second, the smallest and largest gap between two frames, in bytes on the wire, with reference lines at 12 B (the standard) and 5 B (the tightest legal gap at 10 Gb/s). A narrow band means evenly spaced frames, a tall one traffic in clumps. The chip says evenly spaced, unevenly spaced, frames arrive in bunches, or n gaps under 5 B (red: a sender crowding the link).
SENDERS

The Senders table: the sender of the bursts on port A with its count, longest burst, time at line rate, bytes per burst and load.
| Control or column | What it does |
|---|---|
| Clear | Forgets every event and sender gathered so far; the graphs stay. |
| Open in Wireshark | Opens the selected events or senders in Wireshark (section below). |
| Filter box | Plain words match the sender, the port letter or an event time; comparisons such as flat>1ms, bytes>100k, load>50; several terms must all match. |
| Min burst | Off, or ≥13 µs … ≥13.4 ms: shows and marks only events whose burst lasts at least that long. Display only. |
| Window | 1 s, 10 s, 1 min, 10 min or Session: the span the table summarises. |
| ▸ / Port / Sender | Unfold a sender into its events. Sender is who carried more than half the bytes of the burst (IP, or MAC); Port Oversubscription gathers bursts no single sender dominated. |
| Bursts, Longest | Number of bursts in the window, longest single burst. |
| Flat out avg, Flat out max | Time the link spent at 100 % per burst, averaged; the longest unbroken stretch at 100 % (what a receiving buffer must hold). |
| Bytes/burst, Load avg, Load max | Average bytes per burst; the load during the bursts and during the hardest one, as a share of the link. |
Click a row to select it, Ctrl+click to add one, Shift+click for a range; hovering a row marks its moments on the chart. Ten senders per page, with ‹ › to page through.
Open in Wireshark
Select events or senders and click Open in Wireshark. The Manager builds a display filter on the seconds of those events (one second either side) and on their senders, then:
- after a Manager capture, opens the capture file that holds those seconds, filtered; events spanning several files are merged first. If no file holds them (no capture was running, or the ring buffer deleted it) it says so beside the button;
- during a live capture in Wireshark, sends the filter to that Wireshark, which applies it within a few seconds.
Tip. Switch on Microburst records in the file on the Capture page: the bursts are then in the capture too, and Wireshark's Microbursts button and Filter on this burst work on them (section 5.3).
3.4 Ports — 10G, 10G+
What it is for
Choose how the ProfiShark sits on the link (one inline link or two SPAN taps), let each SFP port run at the speed of the module plugged into it, and read everything the modules say about themselves.
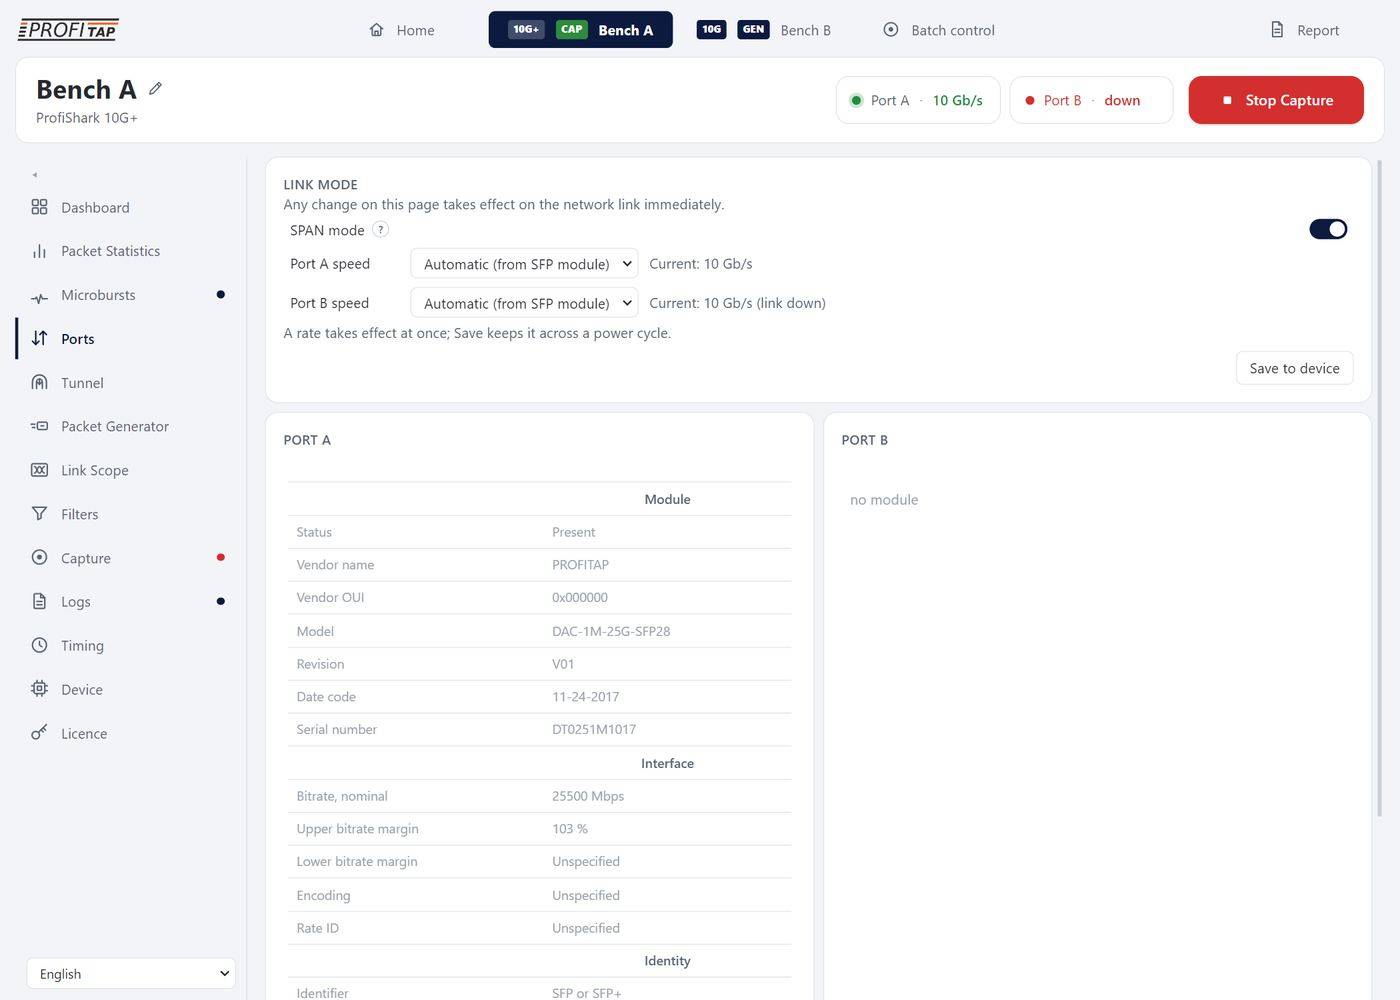
The Ports page of a ProfiShark 10G+: link mode and port speeds, then the module of each cage.
The ProfiShark 100M has no Ports page. Its two ports negotiate with the link partners on their own; the link, its speed and duplex show in the device header and on the Dashboard.
LINK MODE
“Any change on this page takes effect on the network link immediately.”
- SPAN mode: off, the two ports are one inline link through the tap; on, they are two independent taps (two SPAN or mirror ports, two links). Going back to inline turns the tunnel endpoints off and stops a running generator; the chosen speeds are kept.
Port speed, and automatic speed selection
new
| Choice | What the port does |
|---|---|
| Automatic (from SFP module) (default) | The port runs at the rate of the module in its cage: the Manager reads the module's nominal signalling rate (in the module's EEPROM) and sets 1 Gb/s for a module under 5 Gb/s, 10 Gb/s otherwise. It does so when you choose Automatic, when the page opens on a unit whose module was changed while it was off, and the moment a module is plugged in. A 1 Gb/s optic in one cage and a 10 Gb/s optic in the other are tapped at once, with nothing to set. |
| 10 Gb/s (10GBASE-R) | Forced to 10 Gb/s, whatever the module says. |
| 1 Gb/s (1000BASE-X) | Forced to 1 Gb/s: a 1 Gb/s link on a dual-rate module, or a module whose EEPROM states no rate. |
- Beside each choice, Current shows the rate the port runs at, and ”(link down)“ when there is no link.
- The choice is remembered per ProfiShark. A forced rate stays forced even when it equals the module's rate; a rate set from elsewhere (the command line, another computer) shows as what it is.
- A rate takes effect at once; Save to device keeps SPAN mode and the port rates in the unit across a power cycle. The ProfiShark itself keeps a rate, not “automatic”: Automatic is applied by the Manager while it runs, so a unit used without the Manager starts at the rate last saved.
- Everything follows the port's rate: packet statistics against 1 or 10 Gb/s, the microburst detector's windows, the generator's rates, Link Scope's resolution.
PORT A / PORT B (modules)
“reading…” while the module is read, “no module” for an empty cage. Read again when a module is plugged or unplugged and every 30 s; live diagnostics every 5 s.
| Group | Fields |
|---|---|
| Module | Status, vendor name, vendor OUI, model, revision, date code, serial number |
| Interface | Nominal bitrate (Mb/s), upper and lower bitrate margins, encoding (8B10B, 64B66B, NRZ…), rate ID |
| Identity | Identifier (SFP / SFP+), extended identifier, connector (LC, SC, RJ45, copper pigtail…), wavelength (nm), diagnostics present, checksums (“Both correct” or “MISMATCH”) |
| Live diagnostics (DDM) | Temperature (°C), supply voltage (V), laser bias (mA), TX power and RX power (dBm and µW) — for modules with diagnostics |
The menu dot turns red when both ports lose their link at the same time, blue when a module was plugged or unplugged while you were on another page.
3.5 Ports — 1G, 1G+ and SPE
What it is for
Choose how the ProfiShark sits on the link, what each copper port advertises to the far end, and read what the link actually negotiated: the partner's abilities, the pair wiring, energy saving and every fault the PHY counts.
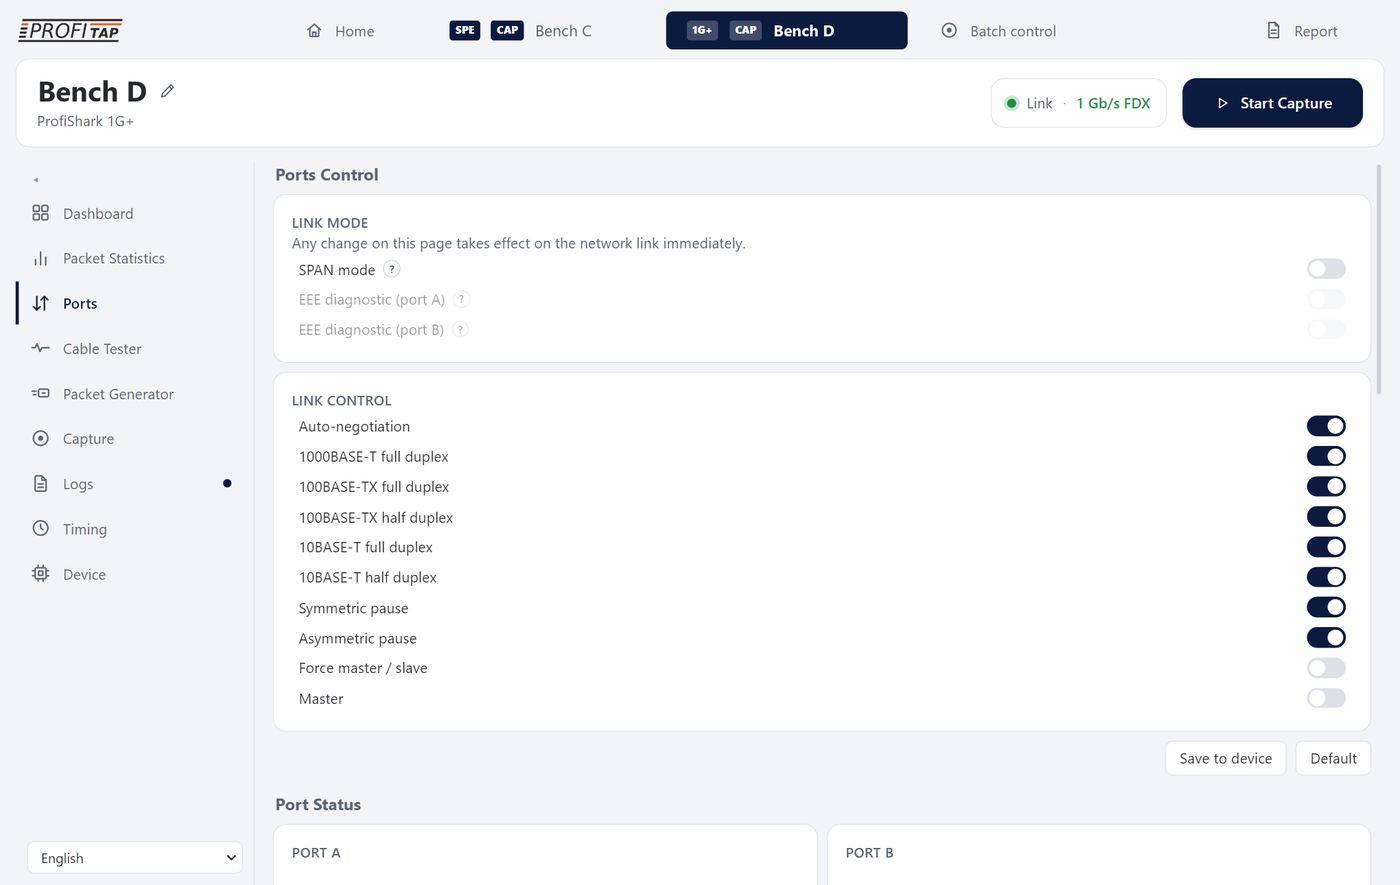
The Ports page of a ProfiShark 1G+ inline: the link mode and the single LINK CONTROL card with what the ports advertise.
The ProfiShark 100M has no Ports page. Its two ports negotiate with the link partners on their own; the link, its speed and duplex show in the device header and on the Dashboard.
LINK MODE
“Any change on this page takes effect on the network link immediately.”
| Setting | What it does |
|---|---|
| SPAN mode | Two independent taps instead of one inline link. Leaving SPAN turns off Loopback and the EEE diagnostic and stops a running generator. |
| Loopback | Sends what one port receives back out of the other (models that have it; SPAN only). |
| EEE diagnostic (port A) / (port B) | The port advertises Energy Efficient Ethernet (802.3az), so the link partner reveals its own EEE advertisement in Port Status. The link renegotiates and drops for a few seconds; SPAN only, greyed inline with the reason. Not on the SPE. |
PORT A CONTROL / PORT B CONTROL — LINK CONTROL when inline
Inline, one card sets both ports, since the link passes through both.
| Switch | What it does |
|---|---|
| Auto-negotiation | On: the port advertises the abilities below and the two ends agree on the best. Off: the port is forced to exactly one speed and duplex — picking a 100 or 10 speed keeps only that one; 1000BASE-T, pause and master/slave are greyed (1000BASE-T cannot be forced). Turning it back on advertises everything again. |
| 1000BASE-T full duplex, 100BASE-TX full / half duplex, 10BASE-T full / half duplex | The speeds advertised. Leave out 1000BASE-T to make a link come up at 100 Mb/s, for instance. |
| Symmetric pause, Asymmetric pause | Flow control advertised. |
| Force master / slave, Master | Gigabit clocking role: forced, and which one, instead of negotiated. |
After each change the page reads the port back, so it shows what the PHY really advertises. Save to device keeps the settings; Default puts back “everything advertised, negotiated, nothing forced”. The status text says “Applying…”, or that the device refused or did not answer.
SPE (10BASE-T1L) ports
SPE
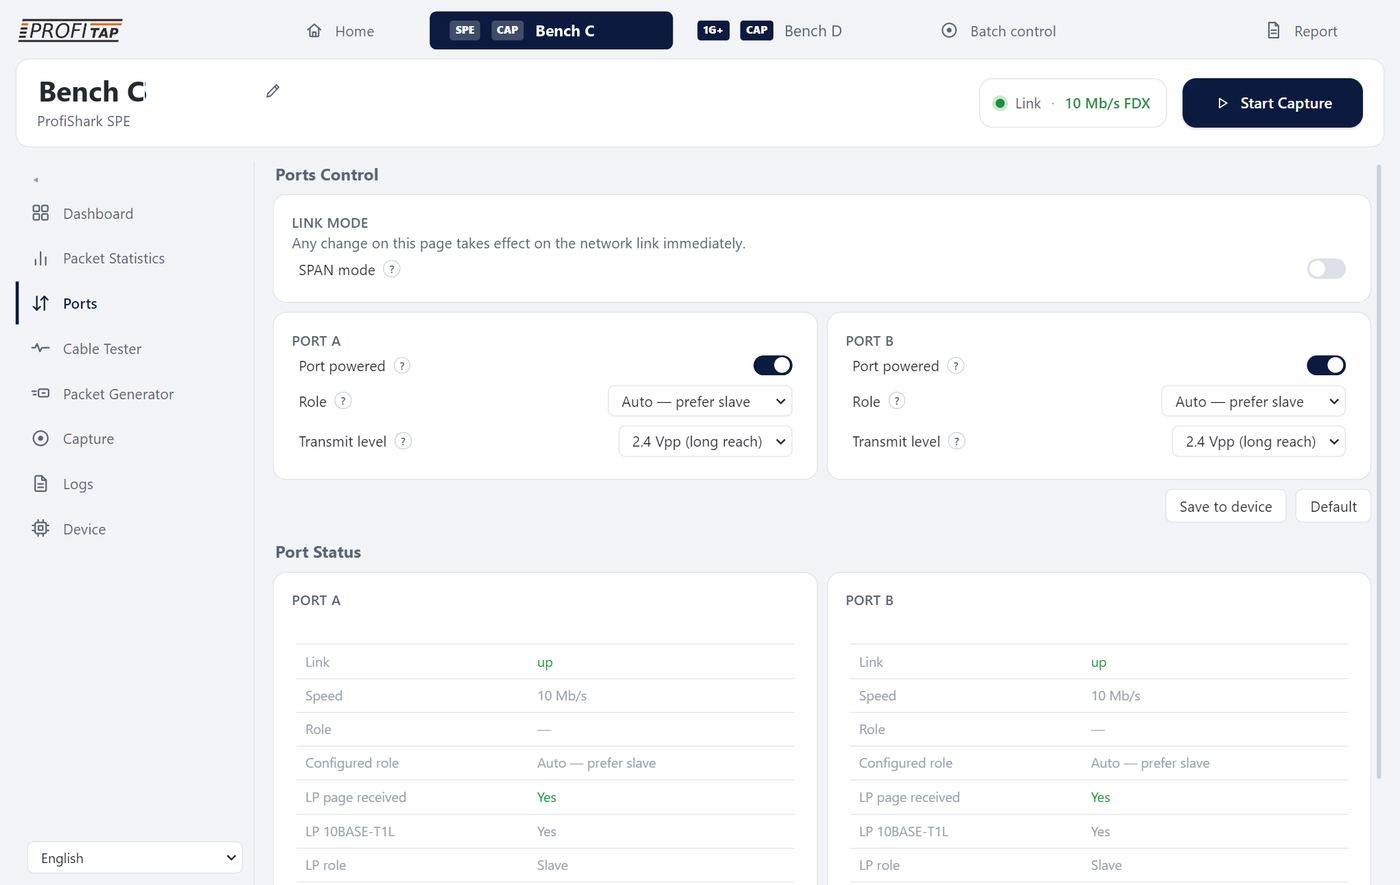
The Ports page of a ProfiShark SPE: Port powered, Role and Transmit level for each port, then the port status.
| Setting | What it does |
|---|---|
| Port powered | Off powers the PHY down: fully silent on the pair. A 10BASE-T1L PHY left on keeps auto-negotiating on the shared pair and can stop the other port linking. |
| Role | Auto — prefer slave, Auto — prefer master, Forced slave, Forced master: which end clocks the pair. Forcing both ends to the same role is the classic reason a link never comes up. |
| Transmit level | 1.0 Vpp (every 10BASE-T1L device), or 2.4 Vpp (long reach), which both ends must advertise and accept — the level for runs up to a kilometre. |
Default on the SPE: 1.0 Vpp, automatic role.
Port Status
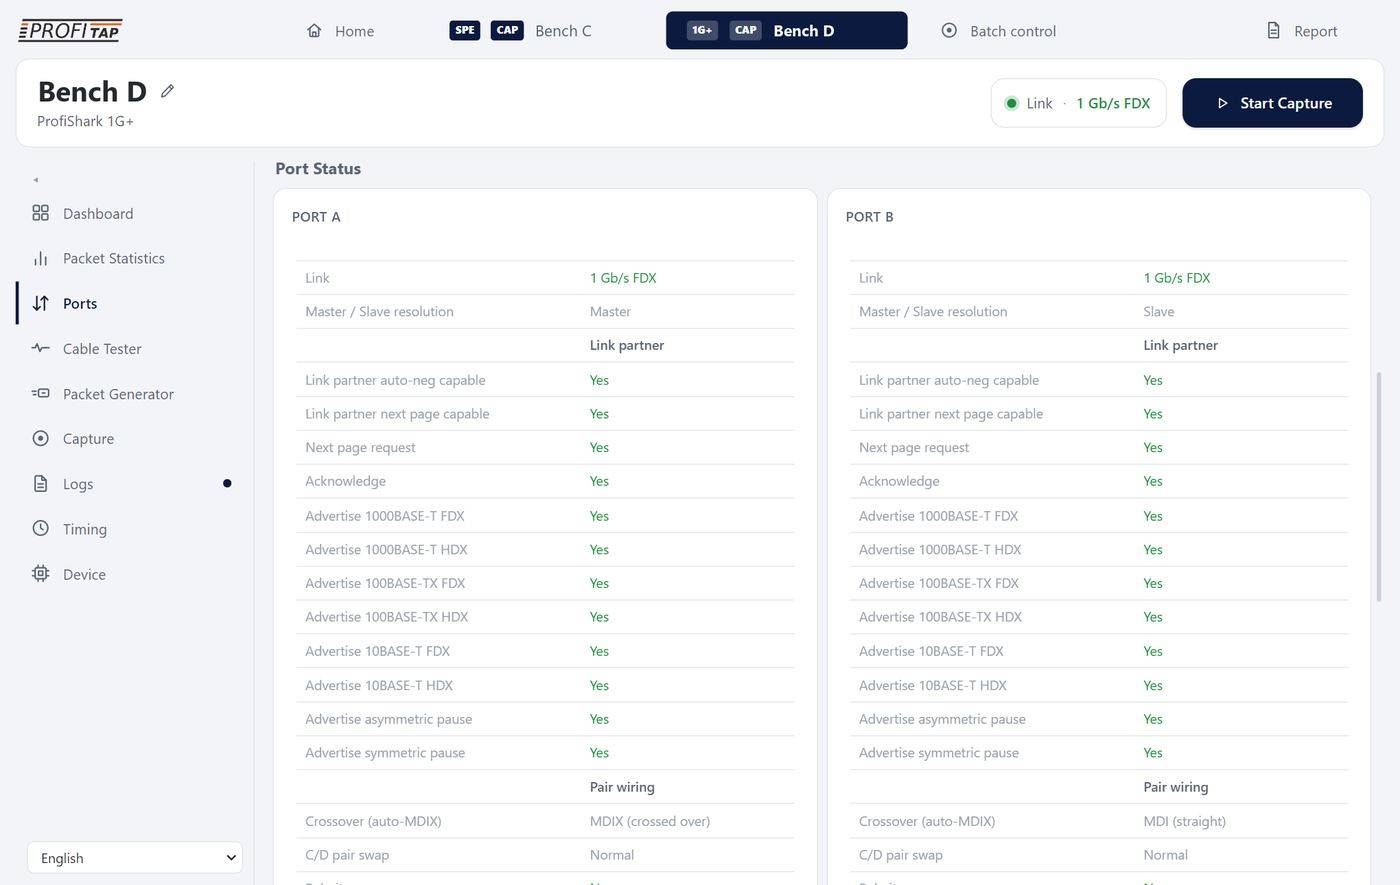
Port Status of a ProfiShark 1G+ on a gigabit link: the link, master/slave resolution and what the link partner advertises, for each port.
Refreshed every second while the page is open: green good, red fault, grey unknown (—).
| Group | Fields (1G, 1G+) |
|---|---|
| Link | Speed and duplex (e.g. “1 Gb/s FDX”), or down; master / slave resolution. |
| Link partner | Auto-negotiation capable, next page capable, next page request, acknowledge; what it advertises: 1000BASE-T, 100BASE-TX and 10BASE-T full and half duplex, symmetric and asymmetric pause. |
| Pair wiring (link up) | Crossover: MDI (straight) or MDIX (crossed); C/D pair swap; polarity swap — “None”, or the pairs miswired (red). |
| Energy Efficient Ethernet | Whether the partner is EEE able (“Not exchanged” until the EEE diagnostic runs), EEE at 1000BASE-T and 100BASE-TX. |
| Faults | Parallel detection fault, remote fault, master/slave fault, local and remote receiver status, 100BASE-TX lock / receive / transmit / SSD / ESD errors, 1000BASE-T lock / receive / transmit / SSD / ESD / carrier extension errors, MDI crossover error, and the idle error count (red when not zero). |
On the SPE: link (up/down), speed (10 Mb/s), resolved and configured role, and what the link partner sent — page received, 10BASE-T1L, its role, 2.4 Vpp, EEE.
3.6 Tunnel
10G10G+new
What it is for
Receive a mirror sent over the network — VXLAN from a data-centre fabric, ERSPAN from a switch several routers away, GRE — and capture the original traffic at wire speed, with the ProfiShark itself as the end of the tunnel: no server to receive it, no software to decapsulate it.
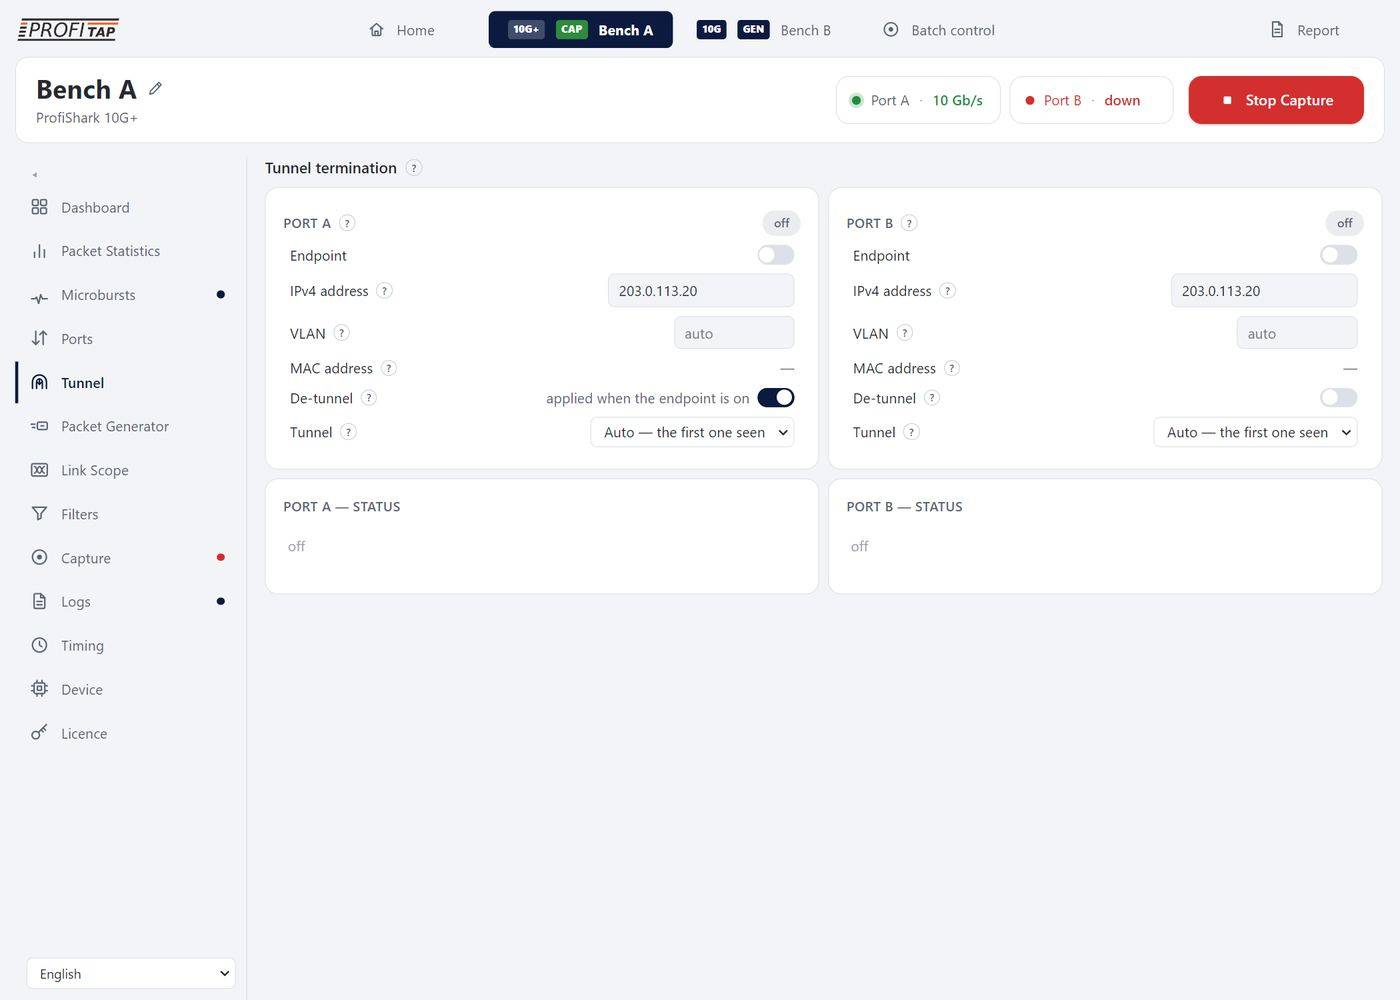
The Tunnel page: per port, the endpoint address, VLAN, De-tunnel and the tunnel to end, then the status of each port.
How it works
- The port becomes a host. With Endpoint on, the port owns an IPv4 address: it announces it (a gratuitous ARP when enabled, then every 30 s) and answers ARP requests and pings for it, from the hardware. The switch or router that sends the mirror therefore has a reachable destination, and its ARP table keeps the ProfiShark's MAC.
- The tunnel is recognised. On the first packets addressed to it, the port identifies the encapsulation — VXLAN, ERSPAN type II or III, GRE carrying Ethernet, IP or IPv6, IP in IP, IPv6 in IP — its sender, its session (VXLAN VNI, ERSPAN session) and where the inner frame starts.
- The tunnel is cut. With De-tunnel on, the FPGA removes the outer headers of every frame at line rate. A pre-filter — a few bytes at fixed offsets that identify this tunnel (EtherType, IP protocol, the endpoint address, the UDP port or GRE type) — lets only this tunnel through and drops everything else in the hardware, so a busy port costs nothing.
- Everything downstream sees the inner frame. The packet statistics, the Filters page (protocols, addresses, ports, VLAN, deep inspection), the timestamps and the capture all work on the original traffic, as if the ProfiShark were plugged into the remote link.
Needs SPAN mode (the page says so otherwise); switching back to inline turns the endpoints off. The packet generator cannot run while a port is an endpoint. Settings are remembered per ProfiShark and re-applied when the Manager reconnects. The menu dot is blue while a port is an endpoint.
Controls (per port)
| Control | What it does |
|---|---|
| State chip | off, no tunnel yet (amber), or the tunnel being terminated, e.g. VXLAN (green). |
| Endpoint | Switches the endpoint on or off. |
| IPv4 address | The address the port answers for (applied when you leave the field). The same address cannot be given to both ports. |
| VLAN | On a trunk port, the VLAN the endpoint announces itself in. Empty = auto: the VLAN in which requests and the tunnel arrive (untagged until something arrives). Replies always go back in the VLAN of the request. |
| MAC address | The address the port answers with (port B uses the next MAC after port A's). |
| De-tunnel | An intent: it can be set before the endpoint is on or before any tunnel arrives; the text beside it says why it waits (“applied when the endpoint is on”, “waiting for the first tunnel packets”). For IP in IP and GRE carrying IP the inner packet has no Ethernet header, so the ProfiShark gives each one a made-up header (to this port's MAC, from the tunnel sender's, with the inner IP EtherType); the original MACs and VLANs are then not in the capture. Off: the traffic arrives encapsulated, and Wireshark decodes the tunnel. |
| Tunnel | Auto — the first one seen (default): the first tunnel to arrive is kept. Or one of the tunnels actually received (type, VLAN, inner IPv6, frame count), or a type by name, shown ”(waiting)“ until it arrives. Choosing one filters the port to it, with De-tunnel on or off. With De-tunnel off, Auto filters nothing. |
Status (per port)
| Row | Meaning |
|---|---|
| ARP | Replies sent, announcements sent, requests seen; when and to whom the last one was. |
| Ping | Echo requests answered. |
| VLAN | The fixed VLAN, or what auto found. |
| Tunnel, Tunnels seen | The encapsulation detected; with several, each with its frame count and the one being de-tunnelled. |
| Source | The tunnel's sender (and how many others). |
| VNI / Session | The VXLAN network identifier or the ERSPAN / GRE session. |
| Packets | Tunnel packets, their rate and bytes; while the cut runs, the frames de-tunnelled by the FPGA. |
| Inner frame | Where the inner frame starts (Ethernet or IP at offset n), and the outer VLAN. |
| Pre-filter | The byte rules the FPGA matches to recognise the tunnel. |
| Other packets | Packets that were not the tunnel, until the filter is armed. |
| Filter | ”only this tunnel passes · n dropped“, armed as soon as the chosen tunnel arrives, or off. |
| De-tunnel | On (with frames too short to cut), armed as soon as a tunnel is detected, or off. |
Setting it up on the switch. Point the switch's VXLAN, ERSPAN or GRE mirror session at the address you gave the port. Check with a ping from the switch; the ARP and Ping rows count it. The Prepared frames set “Tunnels the device terminates” (section 3.16) sends one frame of each encapsulation to 203.0.113.20, for a test without a switch.
3.7 Cable Tester
1G v61G v71G+SPE
What it is for
Check a copper cable from the ProfiShark itself — the length of each pair, or how far away a fault is — without another instrument, and on the SPE watch the quality of a single-pair link continuously.
1G family
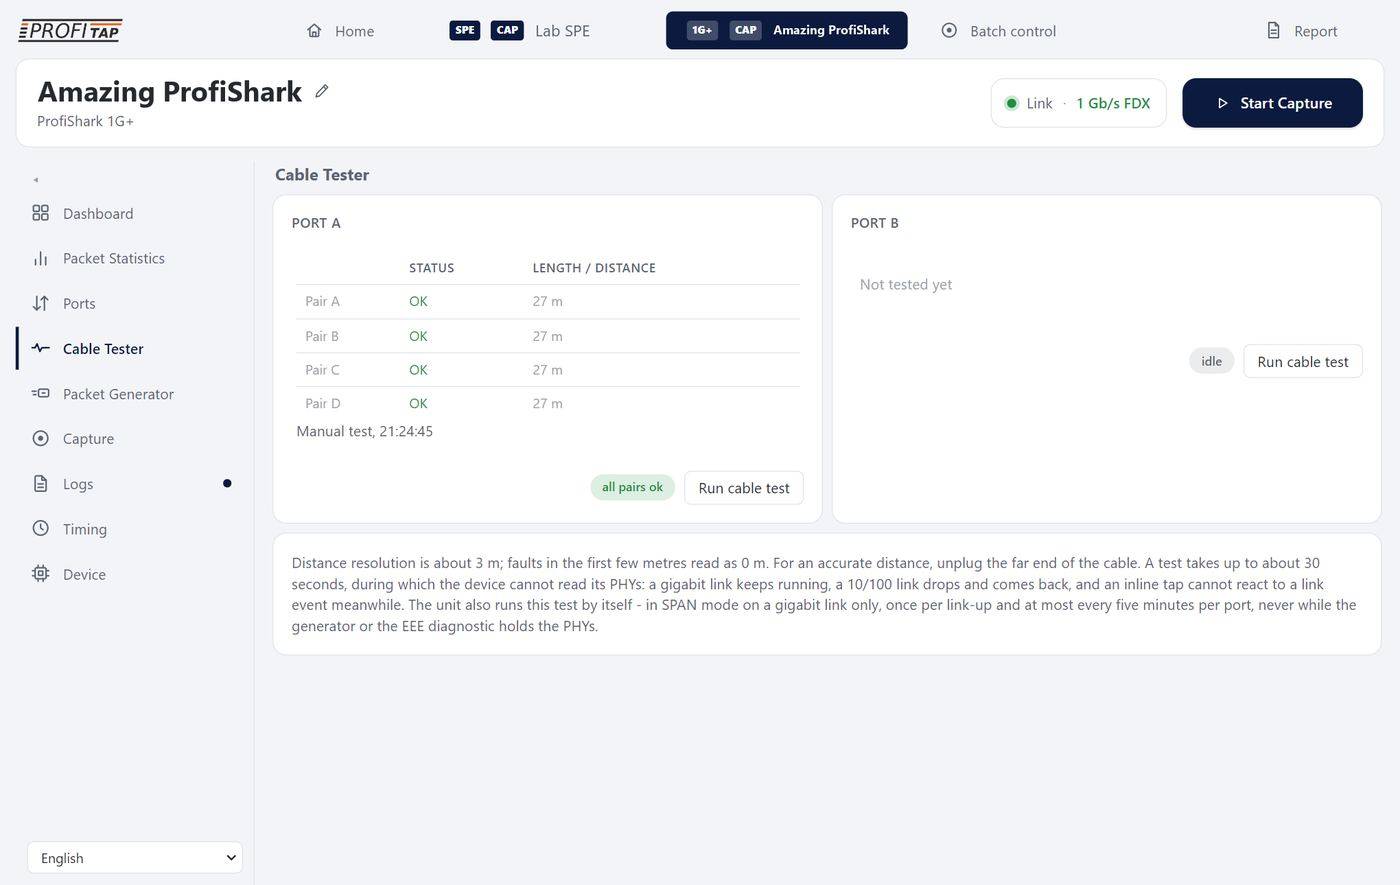
A cable test on port A of a ProfiShark 1G+: the four pairs OK, with the length of each, measured with the link up.
- Run cable test on PORT A or PORT B. The chip reads idle, testing (orange), all pairs ok (green), fault (red), test failed, or automatic test running.
The result, one line per pair (A–D):
Status Meaning OK The pair is correctly terminated; the length is the cable's. Open The pair is cut, or not connected at the far end: the length is the distance to the break. Short The two wires of the pair touch: the distance to the short. Abnormal termination The far end does not terminate the pair correctly (wrong impedance, damaged port). Short to pair X, Abnormal coupling with pair X The pair touches, or couples into, another pair: a crushed cable or a badly made connector. The length reads ”< 3 m“, n m, or “—”; the footer says whether it was a manual or an automatic test, and when.
- Resolution is about 3 m; faults in the first metres read 0 m. Unplug the far end for an accurate distance.
- A test takes up to about 30 s. A gigabit link keeps running during it; a 10/100 link drops and comes back. An inline tap cannot react to link events while it tests.
- In SPAN mode on a gigabit link the ProfiShark also tests by itself, once per link-up, at most every five minutes per port, and never while the generator or the EEE diagnostic holds the PHYs. Both buttons are greyed while an automatic test runs.
SPE (10BASE-T1L)
SPE
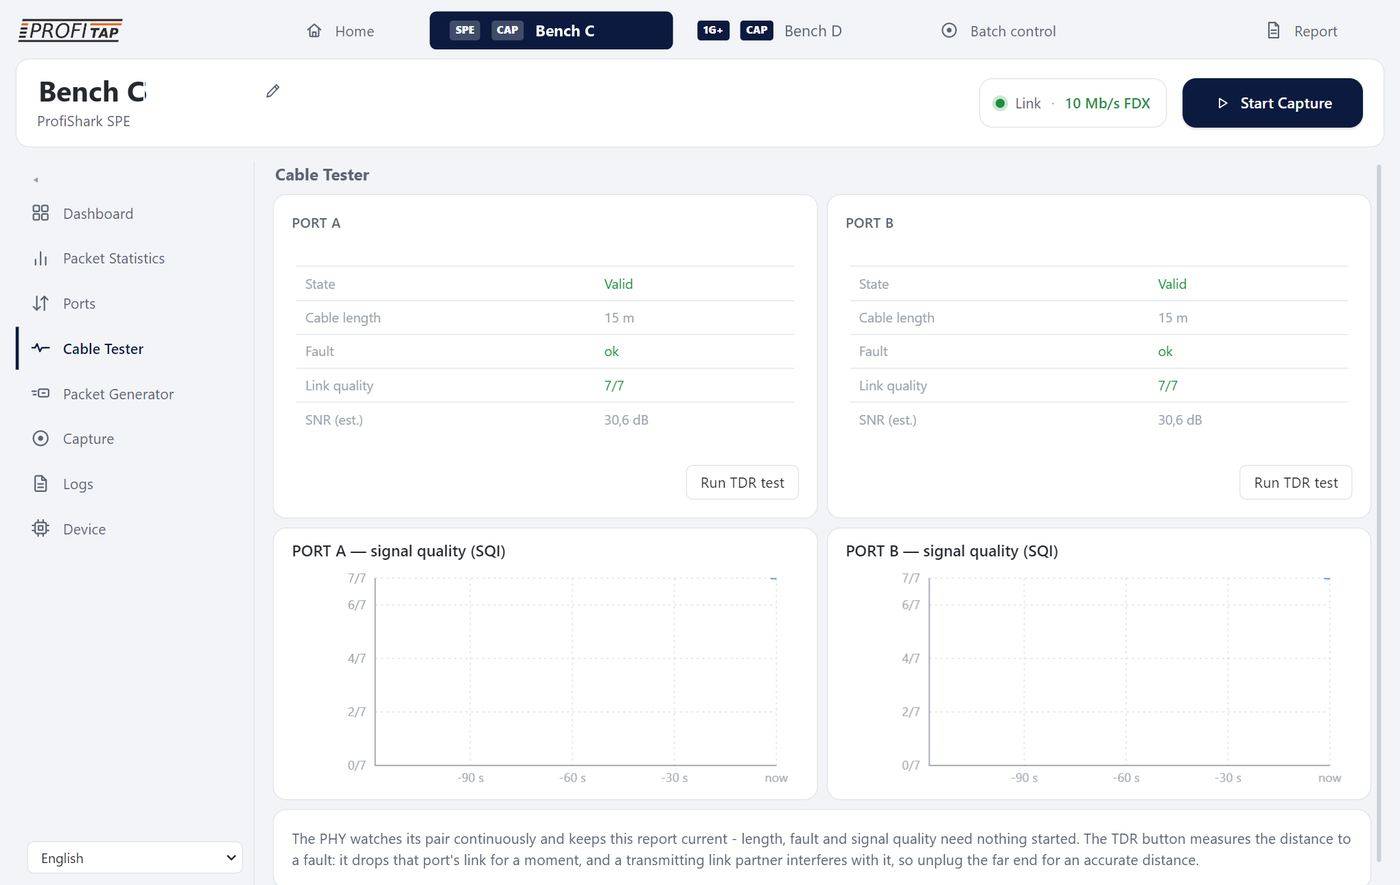
The Cable Tester of a ProfiShark SPE: state, cable length, fault, link quality and SNR of each port, read continuously, and the signal-quality charts.
- Nothing to start: the PHY watches its pair all the time. Per port: State (Unsupported, Stopped, Running, Valid, Invalid), Cable length with the link up, or Distance to fault; Fault (ok, open circuit, short circuit); Link quality (0–7, coloured); SNR (est.) in dB.
- Run TDR test: measures the distance to a fault by reflectometry. It drops that port's link for a moment, and the button is greyed for about 4 s.
- PORT A / PORT B — signal quality (SQI): two minutes of the link quality, 0–7; a link down is drawn as 0. A quality that dips when something switches on nearby is interference on the pair.
- Unplug the far end for an accurate distance: a transmitting partner interferes with the measurement.
3.8 Link Scope
10G10G+new
What it is for
Judge a cable, an optic or a transceiver on a live link, without a scope and without breaking the link: the receiver measures the signal it gets and the page gives the margins, a verdict and what to do.
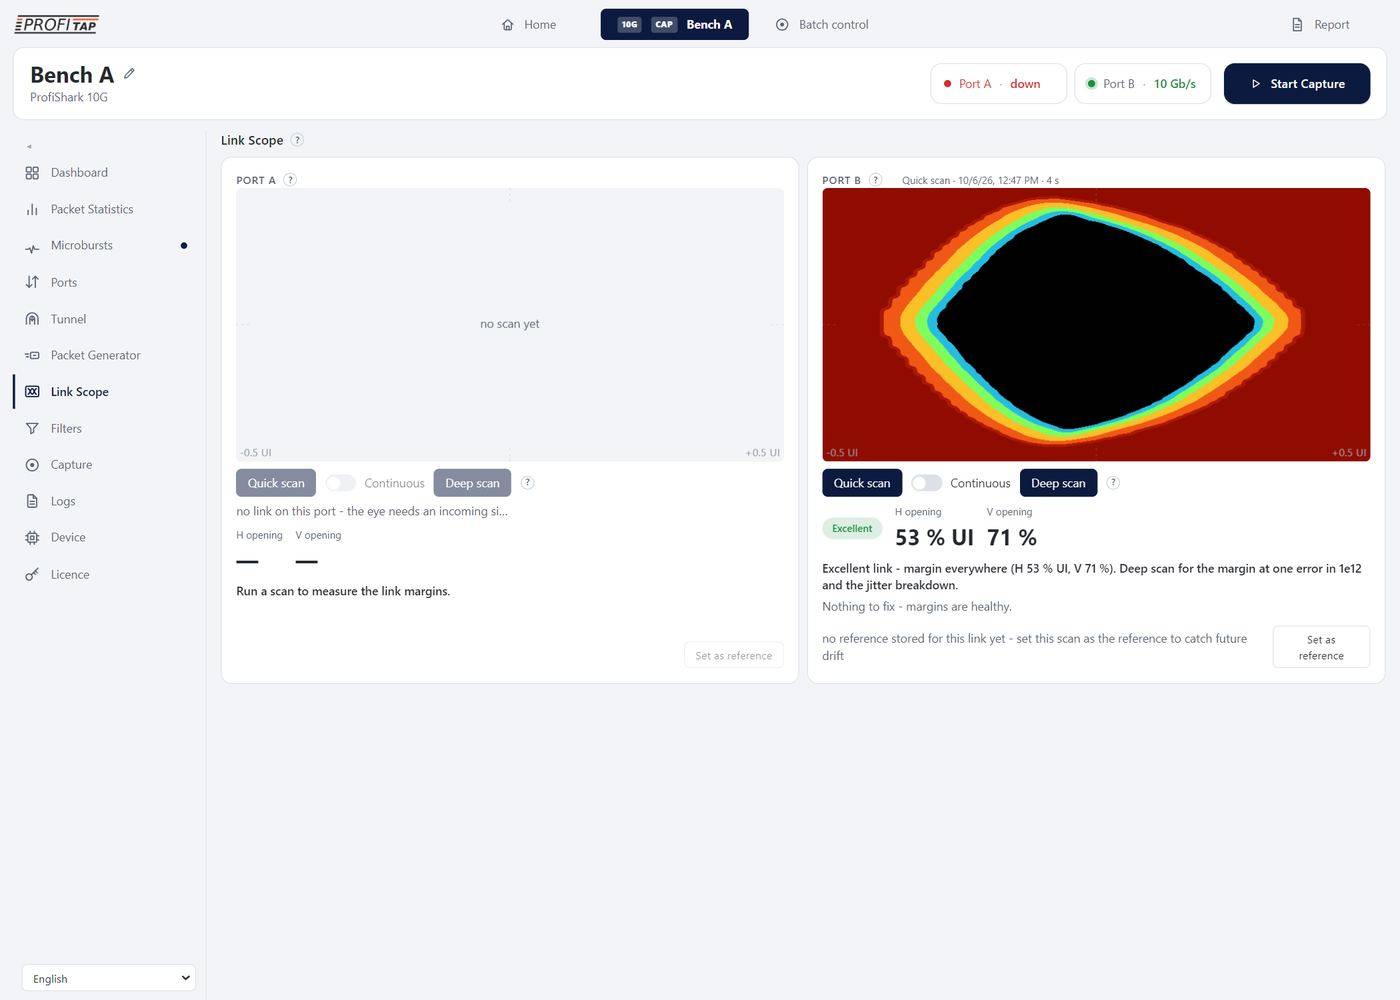
A quick scan of port B in 4 seconds over a 1 m DAC: the whole eye inside the frame, horizontal opening 53 % of the bit, vertical 71 %, verdict Excellent. Port A has no link, so there is nothing to scan.
- Quick scan: one sweep at full detail, in seconds: the eye, the margins and a first verdict. Becomes Stop while it runs.
- Continuous: sweeps over and over, refreshing the eye live, while someone moves a marginal cable. Both ports can run at once.
- Deep scan: a fresh eye, then longer and longer looks: the bathtub curve, the estimated bit error rate, deterministic and random jitter, and the margin left at one error in 1012.
- The eye: black is the opening (no error), green to red rising error rates. H opening is the timing margin (share of one bit), V opening the level margin. The verdict reads Excellent, Good, Marginal or Critical, with a diagnosis and numbered recommendations (reseat, swap the cable, clean the fibre, check the far transmitter…).
- One equaliser setting for every scan. The receiver normally adapts its equaliser to each link on its own, and the eye is measured after it, so two ports, or the same port on two days, would each be shown at their own setting. For the scan, the ProfiShark holds the equaliser of both ports at one reference setting, then gives the receiver back its own: every eye is on the same scale and two scans compare. The link stays up meanwhile. The setting is chosen so that even a strong signal (a short DAC) shows its whole eye inside the frame. The eye is the one at that setting, not the receiver's day-to-day one, so its height can differ a little from what the adapted receiver would show.
- RX power (modules that report it): the received optical power and its last 3 minutes; comfortable above −8 dBm.
- Set as reference stores this scan for the link; later scans are compared with it (“vs reference: H ±n pts, V ±n pts”) to catch drift. Remove reference deletes it. A reference stored by an earlier version, taken at the receiver's own equaliser setting, is not compared with the new scans: set it again.
Not available on a port without link, on a copper SFP with a PHY (the eye would be the module's own internal link; DAC cables are fine) or while a capture runs. A scan keeps running if you go to another page; the menu dot is blue meanwhile.
3.9 Filters
What it is for
Keep only the traffic you need, decided in the hardware at line rate, when the link carries more than the computer can take.
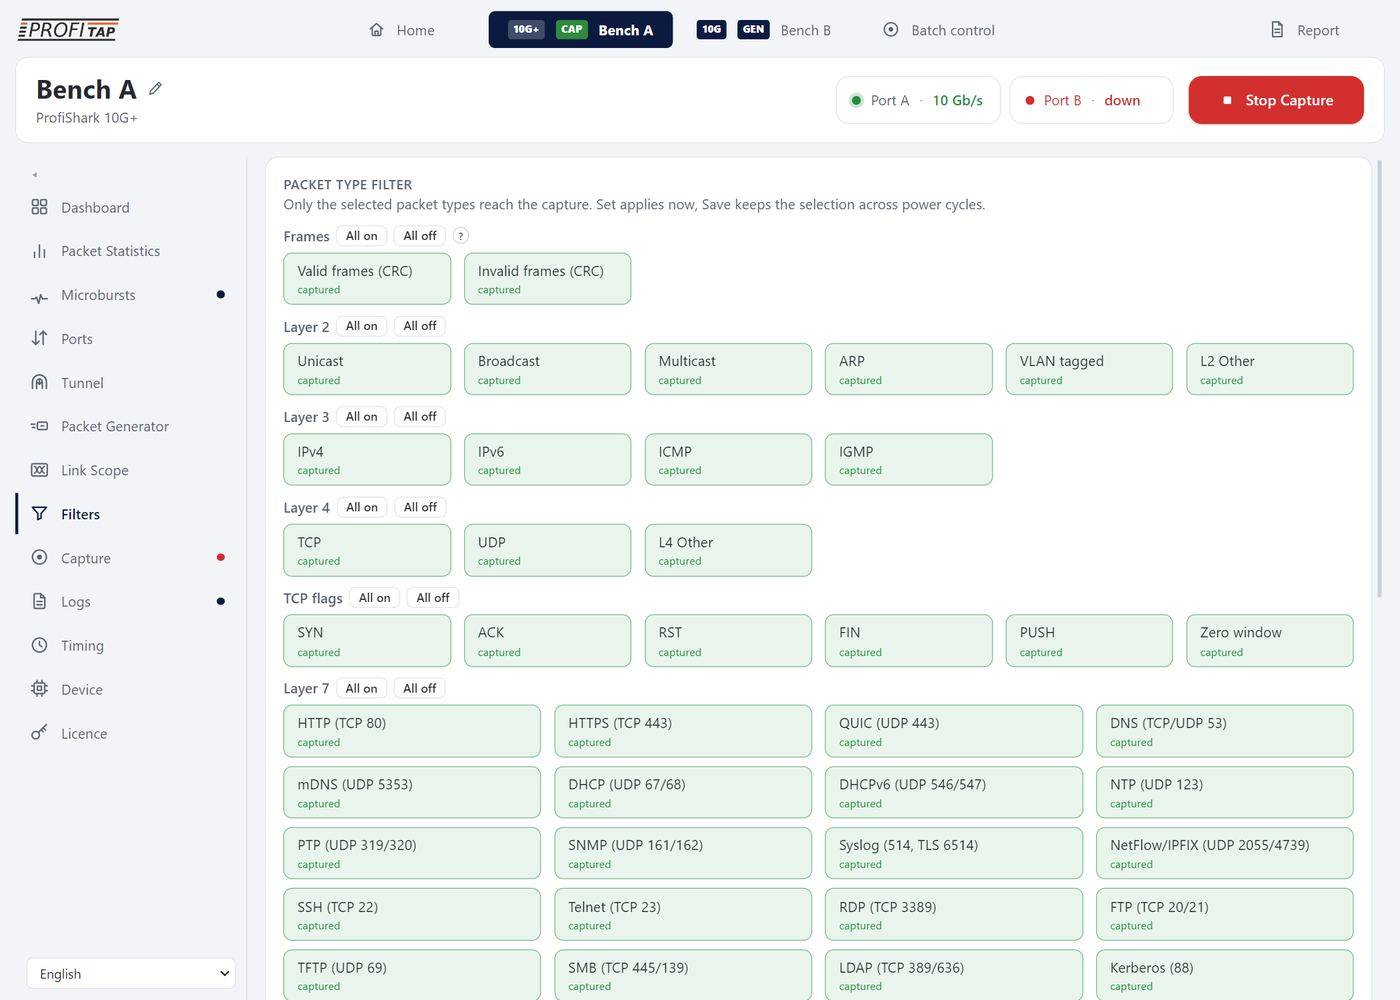
The packet type filter: each tile is a packet type, green captured, grey not.
Three stages, each with Set (apply now, highlighted while the screen differs from what runs) and Save (keep across power cycles). The menu dot is blue while the ProfiShark filters something.
PACKET TYPE FILTER
Click a tile to keep or drop that type; All on / All off per group. Groups: Frames (Valid frames, Invalid frames), Layer 2 (Unicast, Broadcast, Multicast, ARP, VLAN tagged, L2 Other), Layer 3 (IPv4, IPv6, ICMP, IGMP), Layer 4 (TCP, UDP, L4 Other), TCP flags (SYN, ACK, RST, FIN, PUSH, Zero window) and Layer 7 by port: HTTP, HTTPS, QUIC, DNS, DHCP, SSH, FTP, SMB, SIP, and on the 10G family new mDNS, DHCPv6, NTP, PTP, SNMP, Syslog, NetFlow/IPFIX, Telnet, RDP, TFTP, LDAP, Kerberos, IKE, VXLAN.
FIELD FILTER
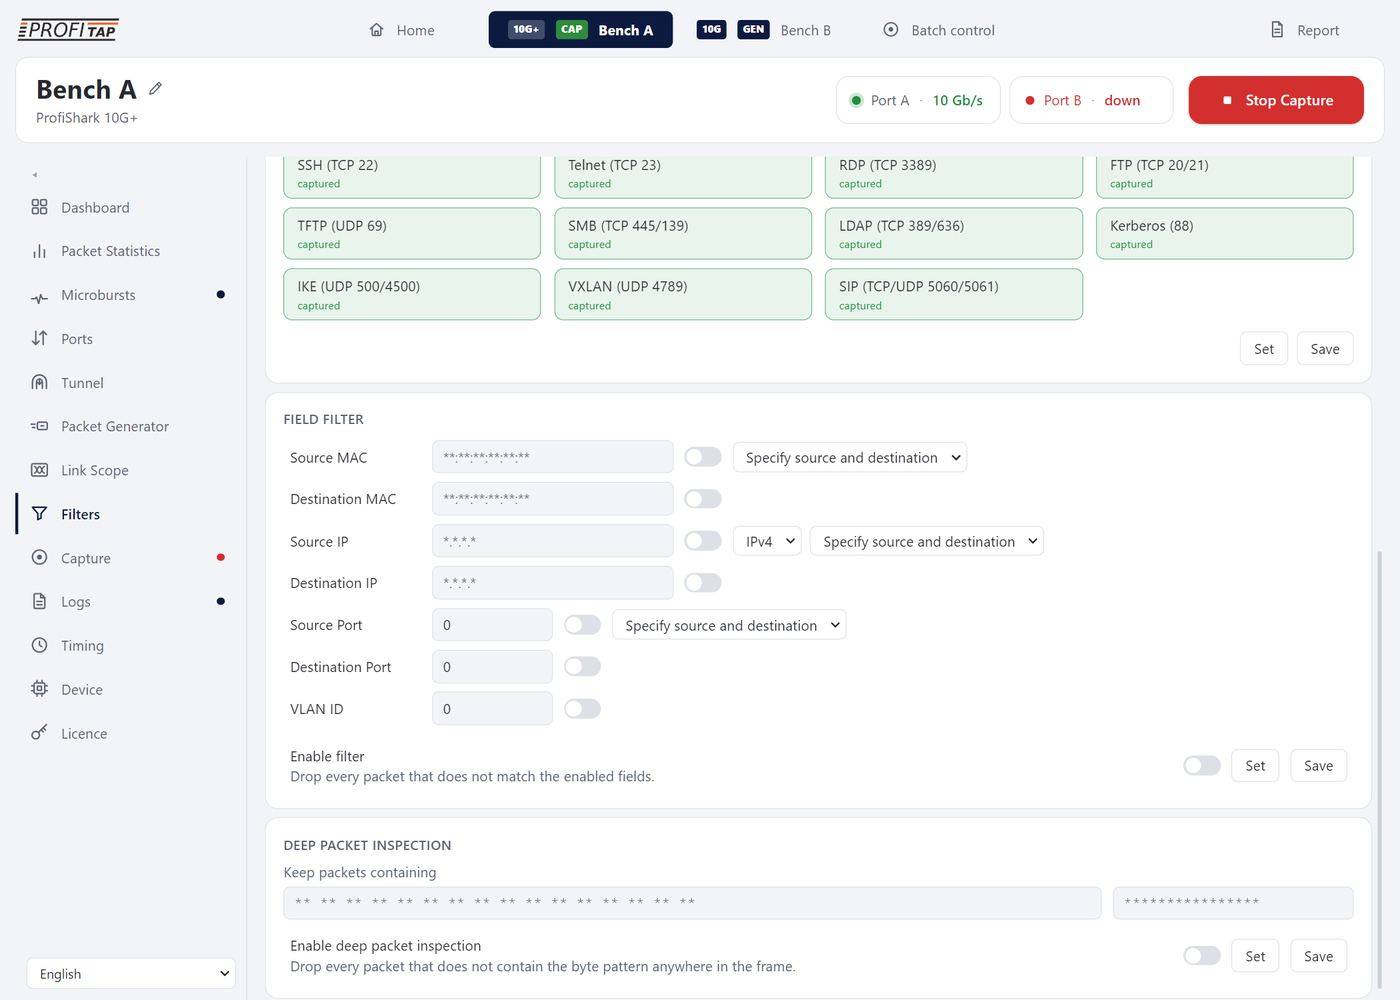
The field filter and the deep packet inspection card.
Source and destination MAC (wildcards allowed: aa:bb:*:dd:*:*), source and destination IP (IPv4 or IPv6, IPv6 written in full), source and destination port, VLAN ID — each with its own switch. For each pair, Specify source and destination (both must match) or Source or destination (either may). Enable filter drops every packet that does not match the enabled fields.
DEEP PACKET INSPECTION
Up to 16 bytes, typed in hex or ASCII; Enable deep packet inspection drops every packet that does not contain the pattern anywhere in the frame.
Behind a tunnel endpoint with De-tunnel on, the filters see the inner frame.
3.10 Capture
What it is for
Record a link to pcapng files straight from the driver, at the ProfiShark's full rate, for minutes or for weeks, in files cut and kept as you plan, each file saying which unit took it, what its clock was worth and what it lost.
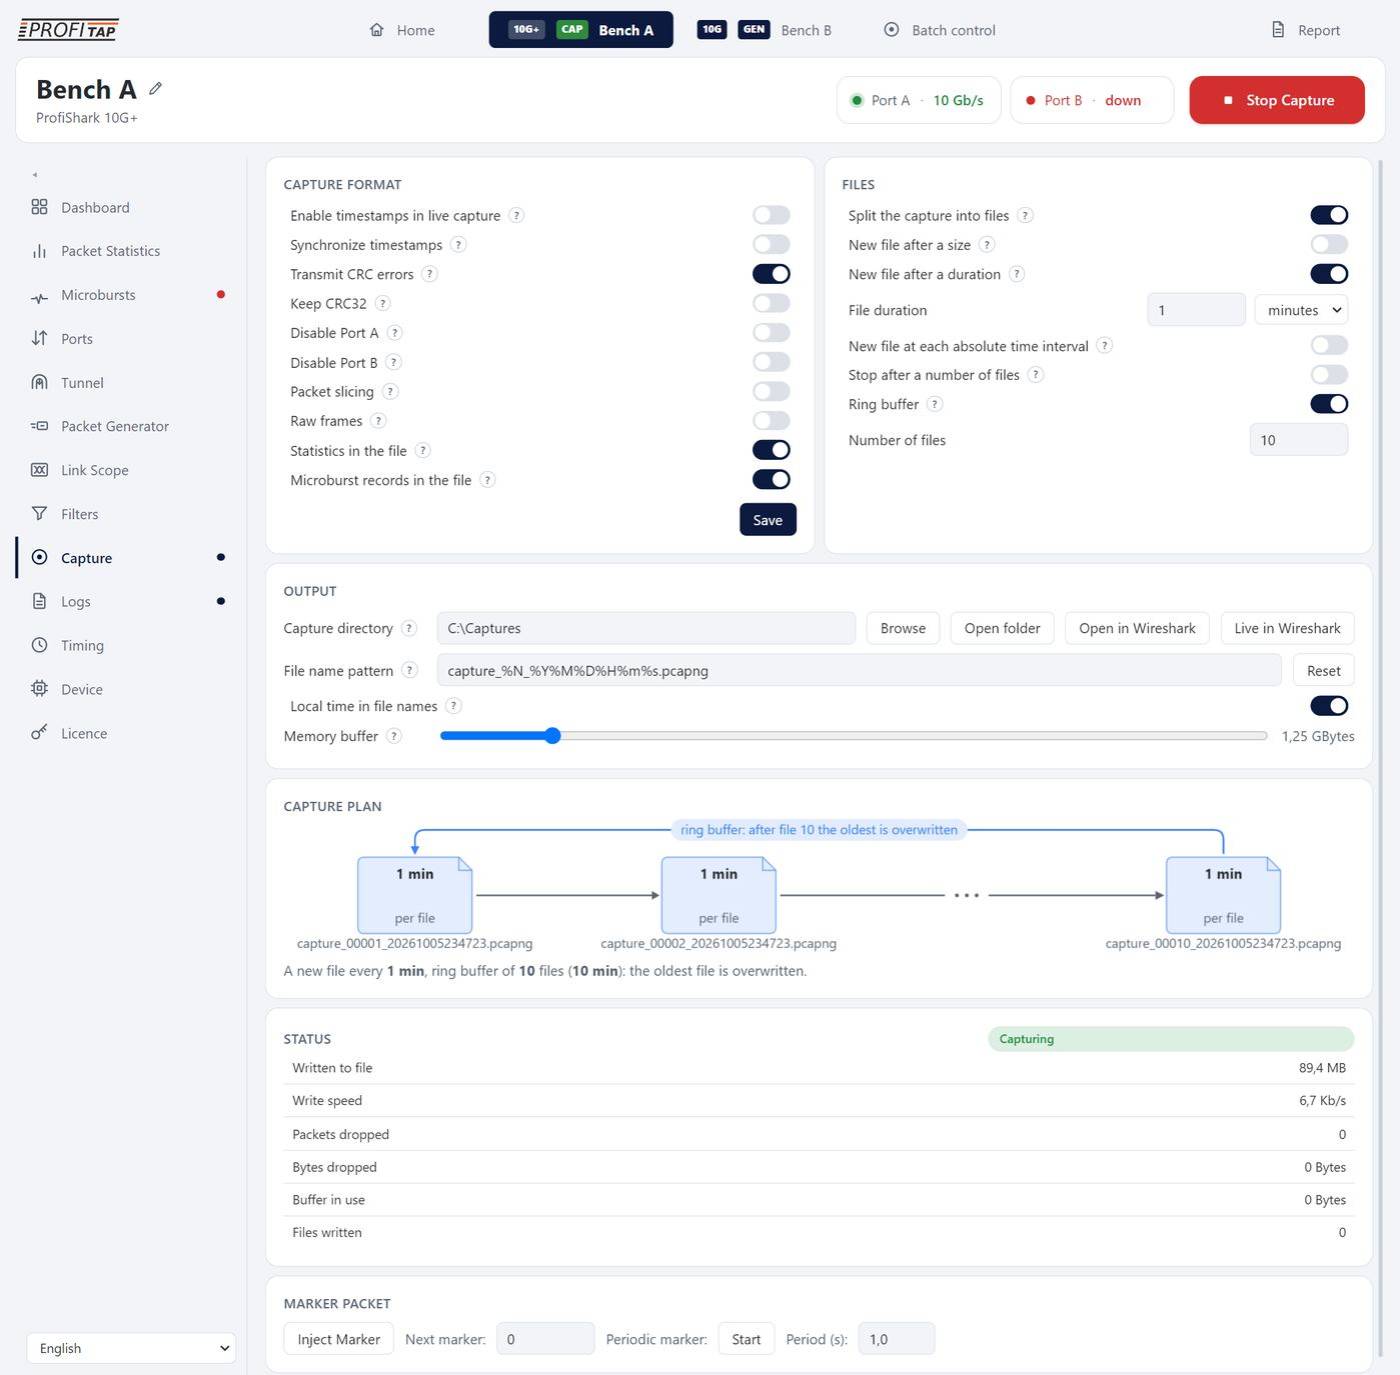
The Capture page during a capture: Capture format and Files (a new file every minute, ring buffer of 10 files), Output, the capture plan, the status and the marker packet card.
A capture runs from the header's Start Capture (or Batch control), with the settings of this page — even if the page was never opened. The ProfiShark timestamps each frame in hardware and sends it over USB; the driver writes the files itself, so a capture keeps running whatever the Manager window is doing.
CAPTURE FORMAT — what the ProfiShark delivers
These are settings of the ProfiShark itself: they act at once, also on a capture run by another program, and Save keeps them across a power cycle (highlighted while what runs differs from what is saved).
| Setting | What it does, and when to use it |
|---|---|
| Enable timestamps in live capture | Adds the ProfiShark's hardware timestamp in front of every frame sent to the computer's network stack, for a live capture on the ProfiShark's own network adapter (Wireshark on the “ProfiShark” interface of Windows). Wireshark shows it in the Time column with the timestamp plugin; without the plugin it appears as 28 bytes of data in front of each frame. A note under the row says when the plugin is missing or out of date, with a link to Home. Not needed for the Manager's captures or the capture plugin, which carry the timestamp in the file. |
| Synchronize timestamps | Re-aligns the ProfiShark's clock with the computer's clock once a second. Use it on a unit without GPS or PPS so its timestamps follow the host's time (NTP-disciplined, typically) instead of drifting freely; leave it off when the unit follows a GPS or a PPS. |
| Transmit CRC errors | Frames with a bad FCS are kept in the capture instead of being dropped. Turn on to see damaged frames when troubleshooting a link. |
| Keep CRC32 | Keeps the 4-byte FCS at the end of each frame, so it can be checked in Wireshark. |
| Disable Port A / Disable Port B | Nothing received on that port reaches the capture: one direction only, half the USB load. |
| Packet slicing | Truncates each captured frame — to the Slice length you set (0–65535 bytes) on the 10G family, to 128 bytes on the other models. The headers are kept and the payload dropped: far less to carry over USB and to write, so a busy link is captured without drops. The original length stays in each frame's record. |
| Raw frames new | Every frame exactly as it came off the wire — preamble, start delimiter and FCS included, aligned on the start delimiter only, with no fragment filter and no link-stability gate: fragments, runts and preemption mPackets reach the capture (decoded by Wireshark as 802.3br mPackets). For diagnosing the physical layer or a TSN link. 10G family. |
| Statistics in the file new | On by default: the per-second statistics described below are written into the file. Turn off only for a tool that expects a bare pcapng. |
| Microburst records in the file new | Off by default: writes what the microburst detector measures into the file (below). Greyed with the reason when the driver on this computer is too old or the licence lacks the detector. 10G family. |
On the 1G family and the SPE slicing is fixed at 128 bytes, and Raw frames and Microburst records in the file belong to the 10G family (greyed elsewhere). Everything else is the same.
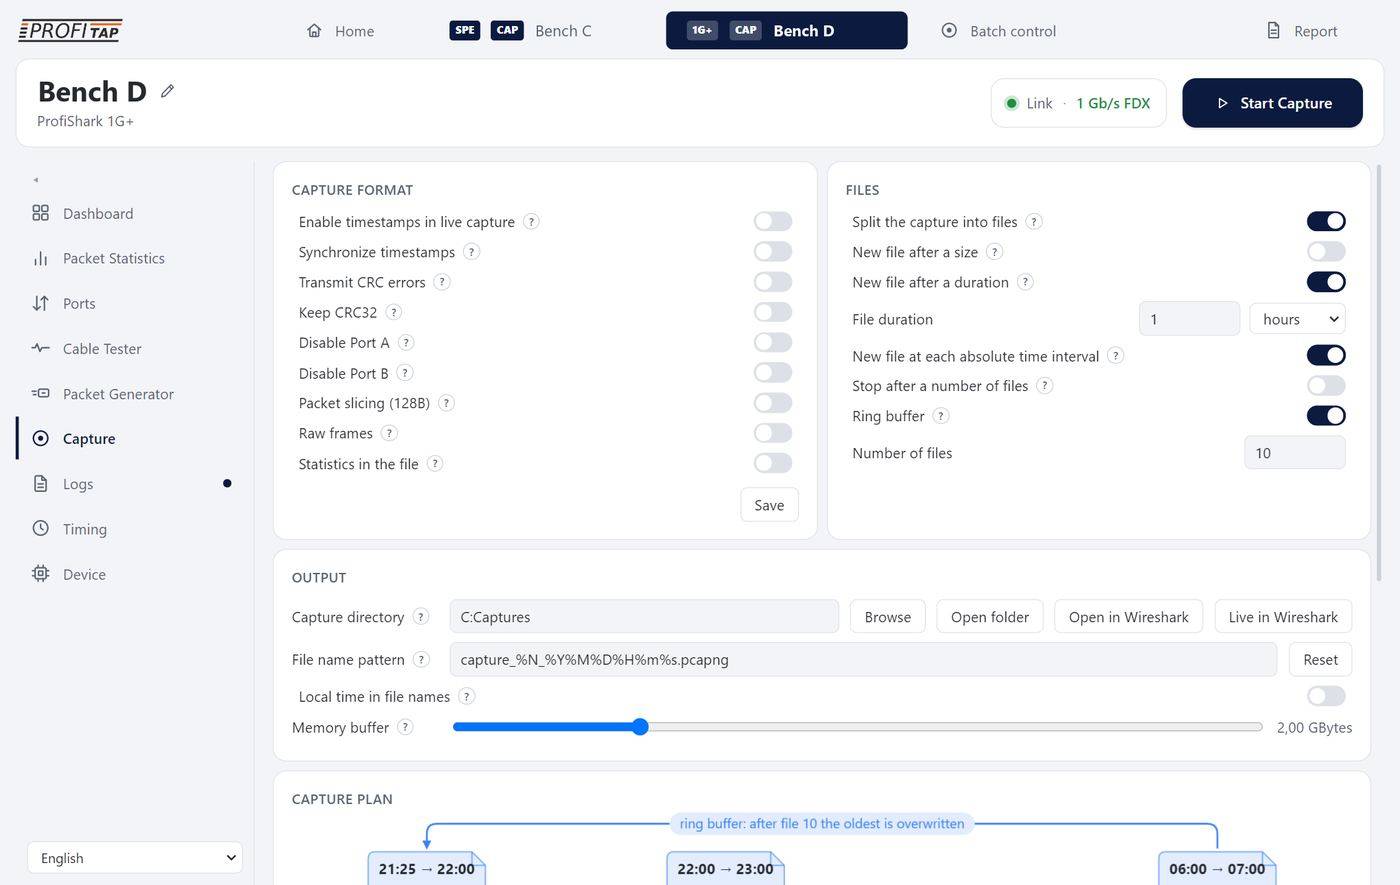
The Capture page of a ProfiShark 1G+: the same cards, with Packet slicing (128B).
FILES — how the capture is cut
| Setting | What it does |
|---|---|
| Split the capture into files | On (default): several files instead of one growing file. Off: one file until the capture is stopped. |
| New file after a size, File size | A new file every n kilobytes, megabytes or gigabytes. |
| New file after a duration, File duration | A new file every n seconds, minutes or hours. With both size and duration on, whichever comes first. |
| New file at each absolute time interval new | For a duration split without size limit: the boundaries fall on round clock times. Started at 10:44 with 1-hour files, the first file closes at 11:00, then 12:00, 13:00… — files that line up with the clock and with other ProfiSharks. |
| Stop after a number of files, Number of files | The capture ends by itself after that many files. |
| Ring buffer, Number of files | The capture runs until stopped, keeping only the most recent files: when a new one opens, the oldest is deleted. A fixed disk budget for an unattended capture that must hold “the last hour” when something happens. The capture strip (section 2.6) shows which seconds are still on disk. |
A file boundary is decided by the frames' own timestamps, not by the computer's clock: the frame stamped 15:00:00.000 is the first of the next file whatever the computer was doing.
OUTPUT
| Control | What it does |
|---|---|
| Capture directory, Browse, Open folder | Where the files go; a folder that does not exist is created at the start. Default: your Documents folder. |
| Open in Wireshark new | Opens the newest capture file of the folder in Wireshark, in your current Wireshark profile (or the ProfiShark profile when “Open Wireshark in it” is on, Home › Wireshark). |
| Live in Wireshark new | Starts Wireshark on a live capture of this ProfiShark through the capture plugin (not while the Manager itself captures: one capture at a time per ProfiShark). |
| File name pattern, Reset | Default capture_%N_%Y%M%D%H%m%s.pcapng. %N is the file counter (required), %Y the year, %M month, %D day, %H hour, %m minute, %s second the file was created. |
| Local time in file names new | The date and time in the name in the computer's local time instead of UTC. |
| Memory buffer | 256 MB to 8 GB (default 2 GB) of memory between the ProfiShark and the disk, to absorb the moments the disk writes slower than the link delivers. A buffer that fills up drops frames: raise it, or use a faster disk, slicing or filters. |
CAPTURE PLAN
new
A drawing of what the settings will do before anything starts: a row of file boxes, each labelled with its size or duration (“whichever comes first”, “first file, shorter” for a file aligned on the clock) and the name the pattern will give it, then the end of the sequence — a red stop after N files, ∞ until stopped, or the ring arrow back to the first file — and one sentence with what it comes to, e.g. “A new file every 1 min, ring buffer of 10 files (10 min): the oldest file is overwritten.”
STATUS
| Reading | Meaning |
|---|---|
| Chip | Idle, Capturing, Capturing elsewhere (another program holds the capture), or why a start failed: the folder cannot be written, the configuration was rejected, the capture engine refused or is missing, the device is gone. |
| Written to file, Write speed | Bytes written so far, and the current write rate. |
| Packets dropped, Bytes dropped | What this capture lost, reset at each start. Hover for the split: hardware drops (the ProfiShark could not pass the frames over USB) and software drops (the computer could not take them: buffer full, disk too slow). The capture strip turns yellow for those seconds and the menu dot red. |
| Buffer in use, Files written | How full the memory buffer is; how many files were closed. |
| A capture started outside the Manager new | When Wireshark (through the capture plugin) or another program captures: since when, and per port the frames received, kept and dropped, second by second. |
| Stop it | When another program holds the capture, or a closed program left the ProfiShark capturing on its own: ends it, after a confirmation for a program still running. |
MARKER PACKET
Inject Marker puts one marker frame, numbered with Next marker (which then counts up), into the capture stream; Periodic marker Start / Stop injects one every Period seconds (from 0.1 s). Markers flag a moment in a long capture (“the test starts now”) and line up captures of several ProfiSharks. A marker carries the time of the last frame captured, or the time of the computer when no frame has come yet.
What a ProfiShark capture file contains
new
| In the file | Content |
|---|---|
| Section header | The hardware (model, MAC, alias), the operating system and the application that wrote it. |
| Interfaces | One per port, with its link speed, the FCS length and the capture filter in force — packet types, address and port filters, VLAN, the deep-inspection pattern, a port switched off, slicing. Microburst records have interfaces of their own. |
| Frames | Each with its hardware timestamp to the nanosecond and the port it came in on. |
| Per-second statistics | Once a second, per port: frames received, frames kept by the filter, frames dropped (counted since the start of the capture), with the clock state — disciplined to a PPS or free running, GPS fix, where the time came from, deviation from the PPS. Decoded by the ProfiShark dissector in Wireshark. |
| Closing statistics | When a file closes (rotation or stop), one statistics block per port with the totals, which Wireshark's Statistics › Capture File Properties shows as received and dropped. |
| Microburst records | With the option on: each second's summary per port (bursts, bytes, packets, backlog peak, time at line rate), and each burst with its start, duration and senders. |
A file opened a year later still says which unit recorded it, whether its clock could be trusted, what it was keeping and what it lost.
3.11 Batch control
What it is for
Start or stop several ProfiSharks at the same moment: captures at several points of a network, or captures and generators of one test.
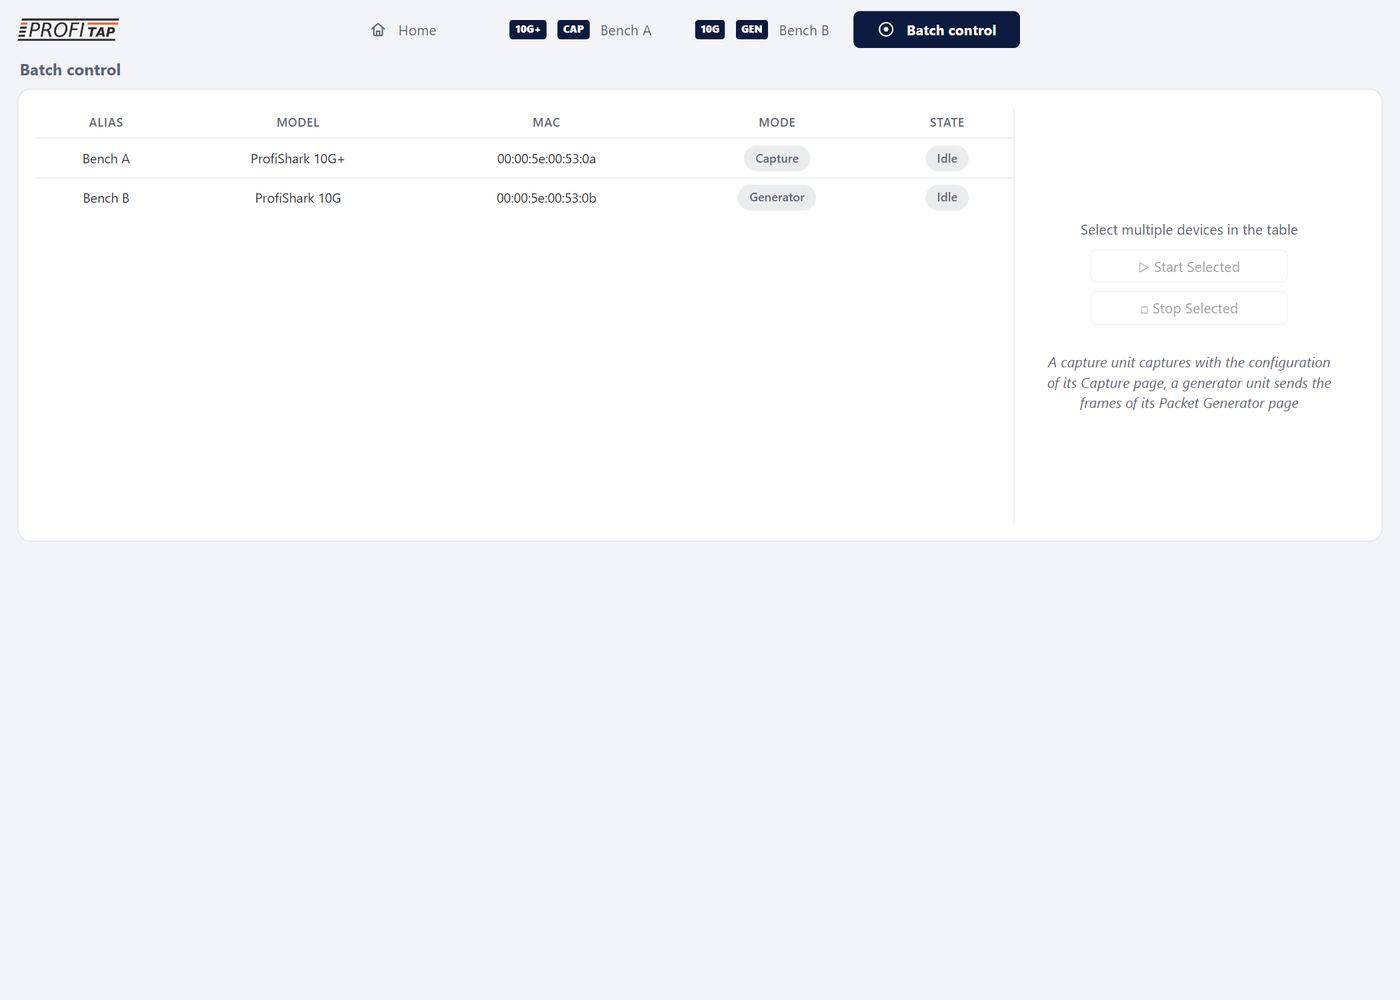
Batch control: every ProfiShark with its alias, model, MAC, mode and state, and Start Selected / Stop Selected.
- The table lists every unit: Alias, Model, MAC, Mode (Capture or Generator) and State (Idle, Capturing, Generating, Capturing elsewhere, Unlicensed, Error). Click rows to select them.
- Start Selected / Stop Selected. A capture unit records with the settings of its own Capture page; a generator unit sends what its Packet Generator page holds. On Start the captures go first so they see the first frame; on Stop the generators stop first. Units that write into the same folder each put their alias (or their MAC) in front of their file names, whatever their file name patterns, so two files started in the same second never share a name.
3.12 Logs
What it is for
The history of what happened to the unit while the Manager watched: links up and down, speed changes, modules plugged, captures started and stopped.
- Clear Log empties it; Export Log saves it as a text file (ISO time, source, message).
- Show events from: Port A, Port B, Capture, Device.
- The table shows the newest first (the last 500; up to 2000 are kept). The menu dot is blue for lines that arrived while the page was closed.
3.13 Timing and synchronisation
GPS / PPS models
What it is for
Decide where the ProfiShark's clock gets its time — the computer, the GPS, a pulse per second from a reference — compensate the cables, keep several ProfiSharks on the same time, and see at any moment whether the timestamps can be trusted.
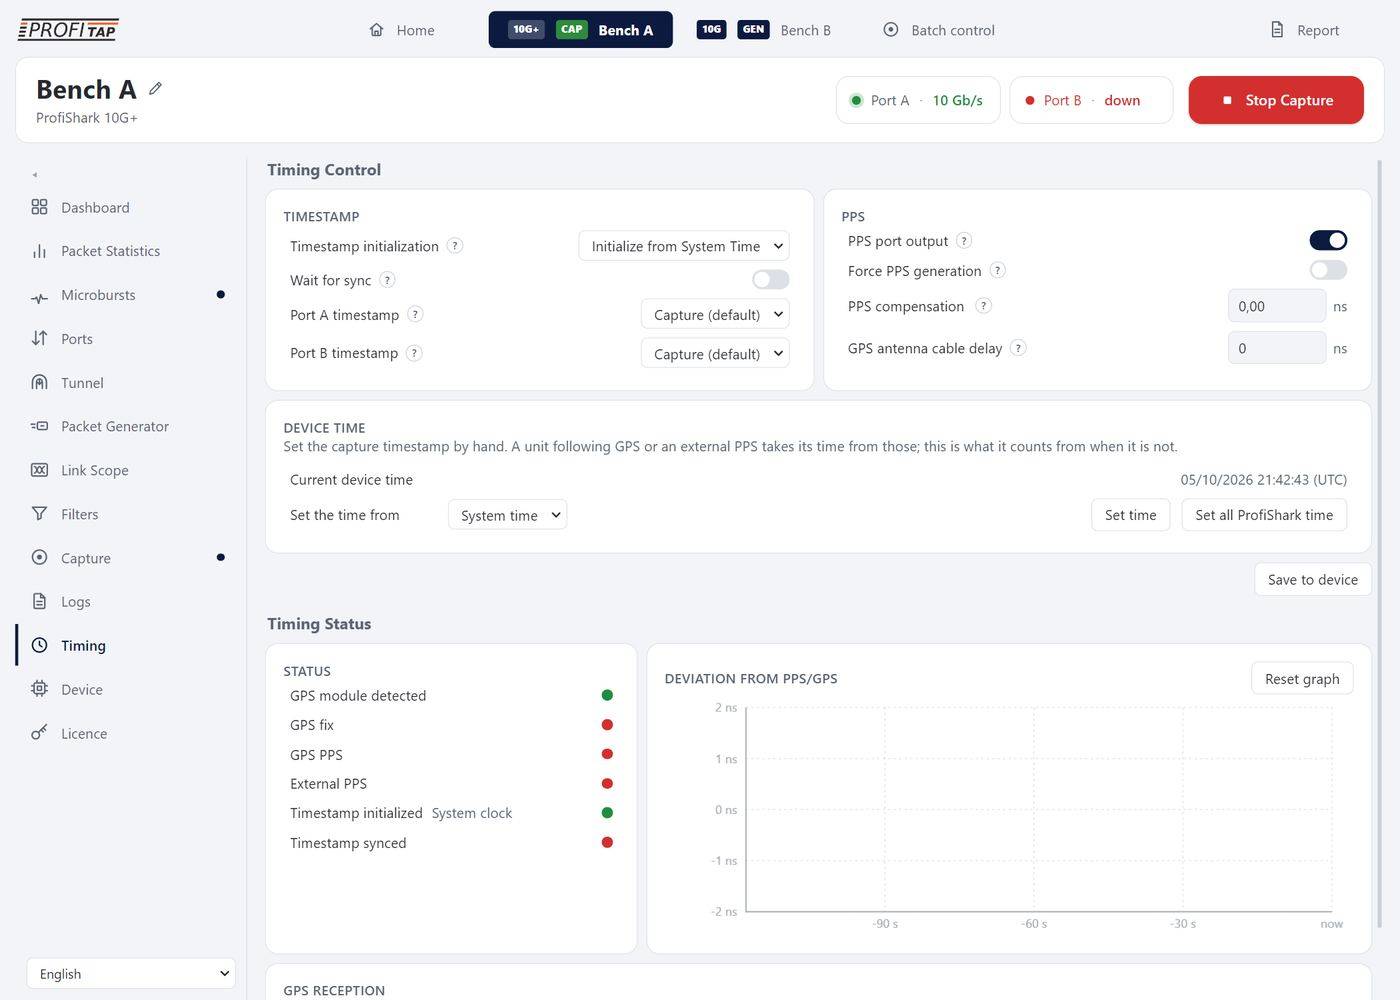
The Timing page: timestamp initialisation, PPS output and compensation, GPS antenna cable delay, the device time, and the timing status with the deviation from the PPS and the satellites.
How a ProfiShark keeps time
- Every frame is stamped in hardware, to the nanosecond, by a counter in the FPGA. Every ProfiShark reports the moment the frame reached its input connector new: the fixed delay of each PHY and each medium (copper, optics, 1 Gb/s or 10 Gb/s, SPE) is compensated per model, so a 1G, a 10G and an SPE give the same time to the same event.
The counter gets its time (the date and the second) from one source and is disciplined (kept from drifting) by another:
Mode Time from Kept by Good for Free running Set once (system time, RTC, by hand) The unit's own oscillator Intervals inside one capture (latency, jitter); absolute time drifts slowly. Host sync The computer The computer's clock, re-aligned every second (Synchronize timestamps on the Capture page) — tighter since 2026, with less drift and less jitter new Captures that must match the computer's logs; as good as the computer's NTP. GPS The GPS receiver The GPS pulse per second Absolute time at any site, and captures at two sites compared frame by frame. External PPS Set from the computer, the RTC or by hand A PPS from a reference (a grandmaster, another ProfiShark) on the PPS connector Several units in one building on the same second. - The clock state is written into every capture file every second, and Wireshark's Expert Information flags a lost PPS or a free-running clock.
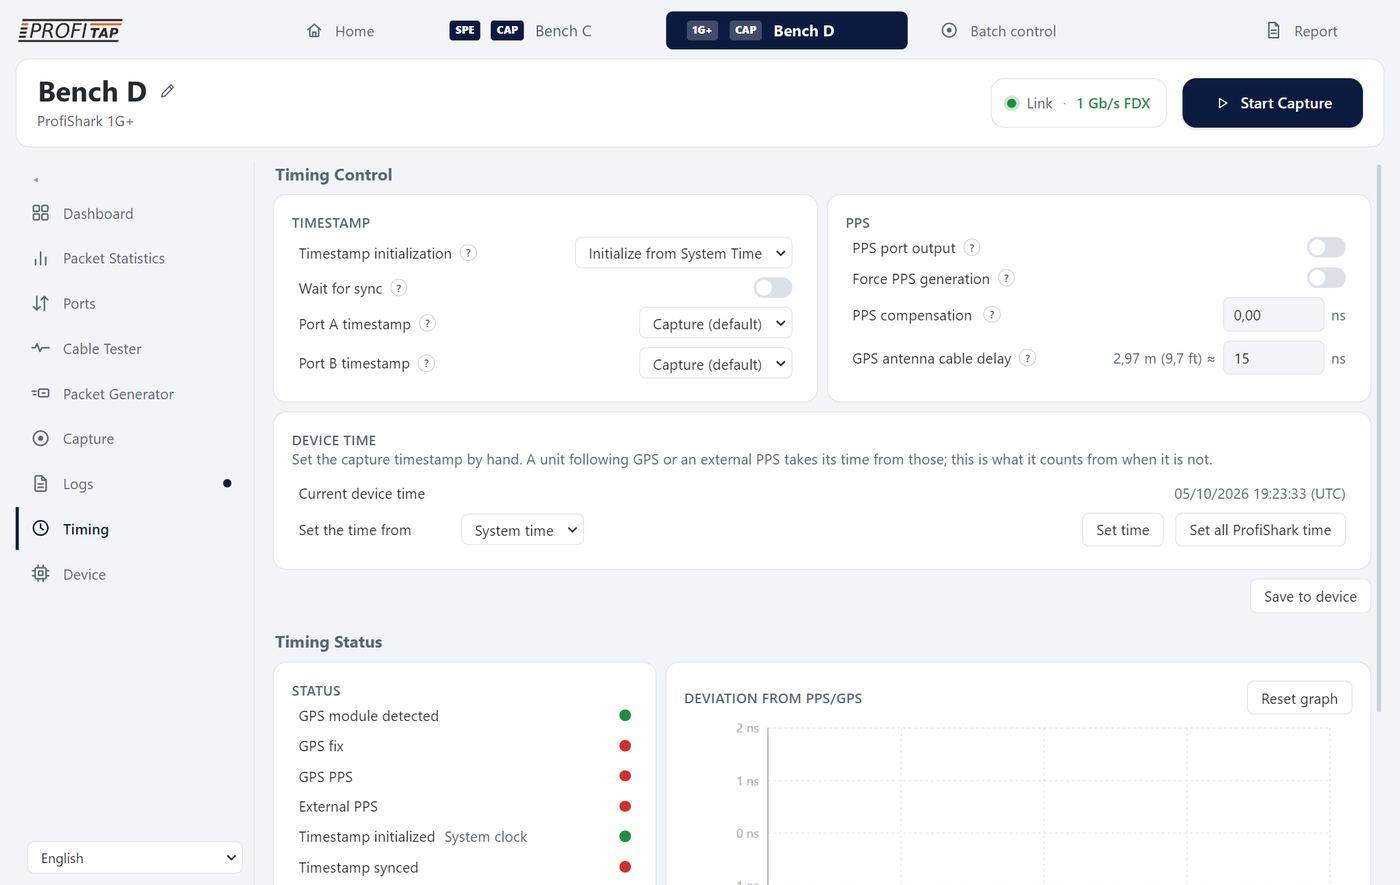
The Timing page of a ProfiShark 1G+ (GPS model): the same settings and status as on the 10G+.
TIMESTAMP
| Setting | What it does |
|---|---|
| Timestamp initialization | Where the clock takes its time at power-up: Initialize from System Time (the computer, default), Initialize from RTC (the unit's battery-backed clock), Initialize from GPS (as soon as the receiver has the time), or Do not initialize. |
| Wait for sync | Holds the capture until the clock is synchronised to its PPS: no frame is ever recorded with a time that is not yet right. |
| Port A timestamp / Port B timestamp | The point of the path where frames of that port are stamped: Capture (default), Ingress (when the frame enters the ProfiShark) or Egress (when it leaves through the other port, inline). Ingress on one port and egress on the other measures the time a frame spends inside the tap. |
PPS
| Setting | What it does |
|---|---|
| PPS port output | The PPS connector becomes an output and gives this unit's pulse per second: connect it to the PPS input of another ProfiShark to put both on the same second. |
| Force PPS generation | Generates the PPS even without a GPS fix (from the unit's own clock), so units chained on it stay together while the GPS has no sky. |
| PPS compensation new | The delay of the external PPS cable: the pulse arrives this much after its source, so the time is set this much forward. Type it in ns, or as the cable itself (“30 m”, “100 ft”), converted at 5.05 ns per metre of coax; the equivalent length shows beside it. Up to 1000 ns — about 198 m of RG-58 or 255 m of LMR-400, a building rather than a rack — in steps of 0.23 ns (5 cm). Older firmware limits it to 59 ns (the help text says which applies). It does not affect the GPS PPS. |
| GPS antenna cable delay new | The delay of the antenna cable: the receiver moves its PPS forward by it. In ns or as a length, up to 1000 ns, applied in whole nanoseconds (20 cm). |
DEVICE TIME
- Current device time: the ProfiShark's clock, in UTC.
- Set the time from: System time (this computer), NTP server (the Manager queries the server you give — e.g.
pool.ntp.org— through the network interface you choose, and remembers both), or GPS. - Set time sets this unit; Set all ProfiShark time sets every connected unit at once. The status says querying…, setting…, time set, or why it failed.
A unit following the GPS or an external PPS takes its time from those; the device time is what it counts from when it does not. Save to device keeps the timing settings across a power cycle.
Timing Status
| Light | Green means |
|---|---|
| GPS module detected | The timing board and its receiver answer. |
| GPS fix | A position fix: green 3D, orange 2D, red none. Without a fix there is no GPS time. |
| GPS PPS | The receiver's pulse per second arrives. |
| External PPS | A pulse arrives on the PPS connector. |
| Timestamp initialized | The clock has a time, and from what: System clock, RTC, GPS, Manual or SNTP. |
| Timestamp synced | The clock is locked to its PPS. |
- Deviation from PPS/GPS: two minutes of the clock's deviation from the PPS at each second, in ns, µs or ms, with the current value in the header. It fills only while a PPS is present. A flat line near zero is a disciplined clock; a slope is drift; steps are a source changing. Reset graph starts it over.
- GPS reception: satellites used and in view for GPS, GLONASS and Galileo new, and the total used. More satellites, and three constellations, hold a fix under a poor sky. Messages say when the timing board is missing or held by another application.
The menu dot is blue while the GPS sees satellites or a PPS arrives.
Synchronising several ProfiSharks
| Situation | Set-up |
|---|---|
| Two sites, far apart | A GPS antenna on each ProfiShark, Timestamp initialization from GPS, Wait for sync on. Both are on GPS time; merge their captures (Home › Merge captures…) and the Seen before column of Wireshark gives the one-way latency of every frame seen at both (section 5.7). |
| Several units in one building, one GPS | The unit with the GPS: PPS port output on (and Force PPS generation to keep the pulse when the sky is lost). The others: its PPS on their PPS input, the cable length in PPS compensation, then Set all ProfiShark time so they all count from the same second. |
| Several units on one computer, no GPS | Set all ProfiShark time from System time or an NTP server, and Synchronize timestamps on each unit's Capture page so they all follow the computer. |
| Generated traffic on the second | The 10G generator's Send: At each GPS PPS / At each external PPS launches a run exactly on each second (section 3.16): with a capture at the far end on GPS time, the one-way delay is a subtraction. |
3.14 Device
What it is for
See what the unit is and what it runs, bring its firmware up to date, switch a 10G between capture and generation, and restart or reset it.
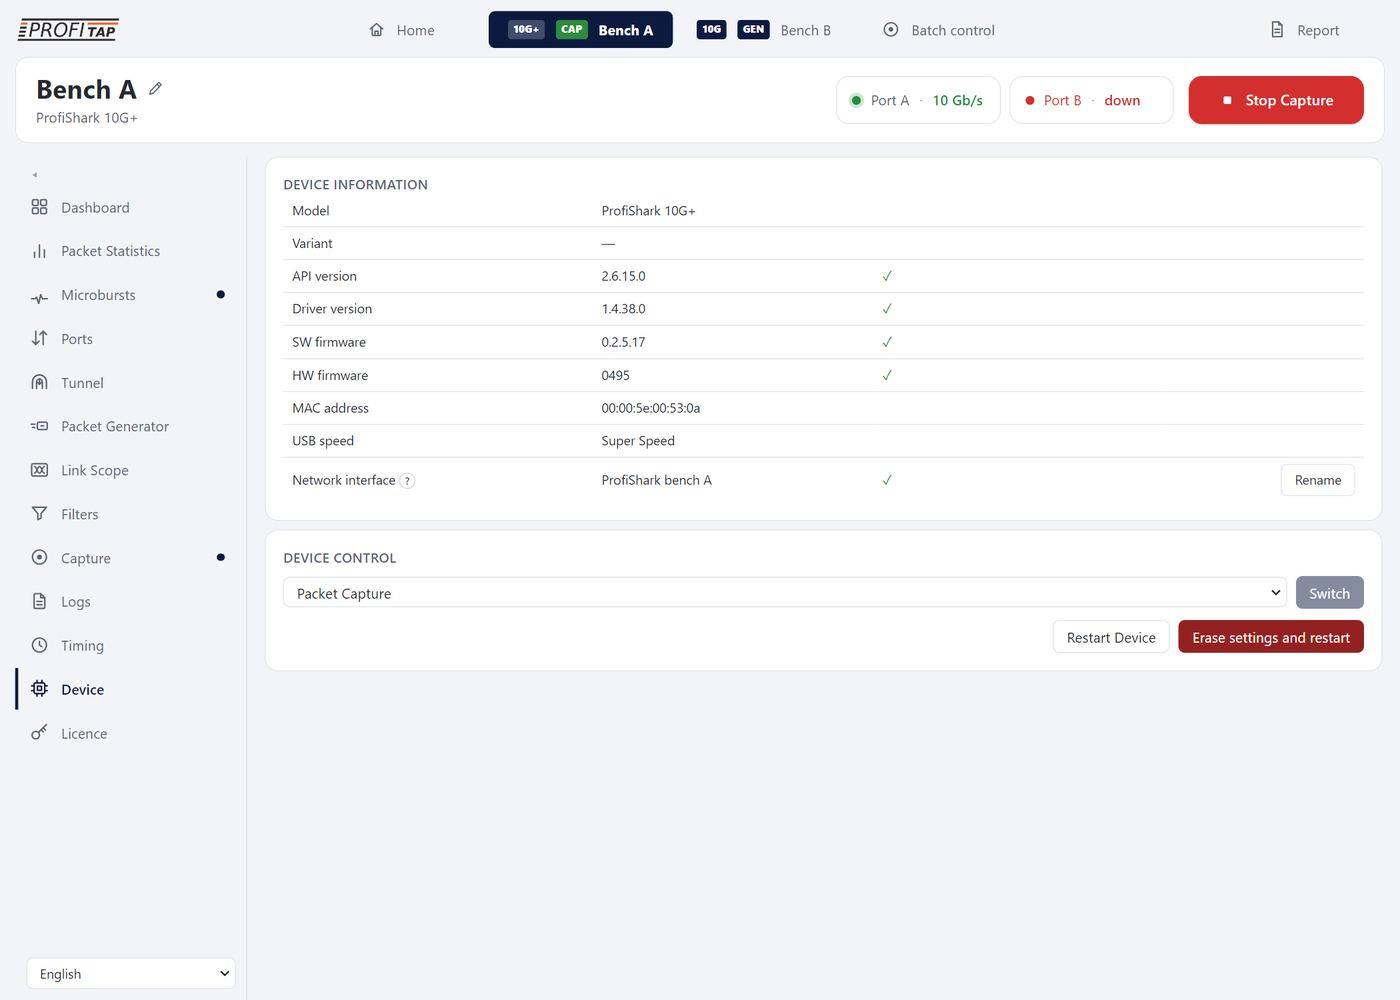
The Device page: model, versions checked against what the Manager needs, USB speed, the Windows network connection name, and Device control.
DEVICE INFORMATION
- Model, variant, API version, driver version, SW firmware, HW firmware, MAC address and USB speed. Each version shows a green ✓, or “needs x” with an Update button when the Manager can bring it up to date (part 4). The library and the driver come with the ProfiShark software: reinstall it to update them.
- Network interface (Windows) new: the name Windows gives the ProfiShark's network connection, which Wireshark shows. Rename it (administrator rights needed; Default name puts back the model and MAC); a running capture is not interrupted.
UPDATE REQUIRED
Shown when the unit is behind what this Manager needs: it lists what is behind. Every other page is hidden until the update is done.
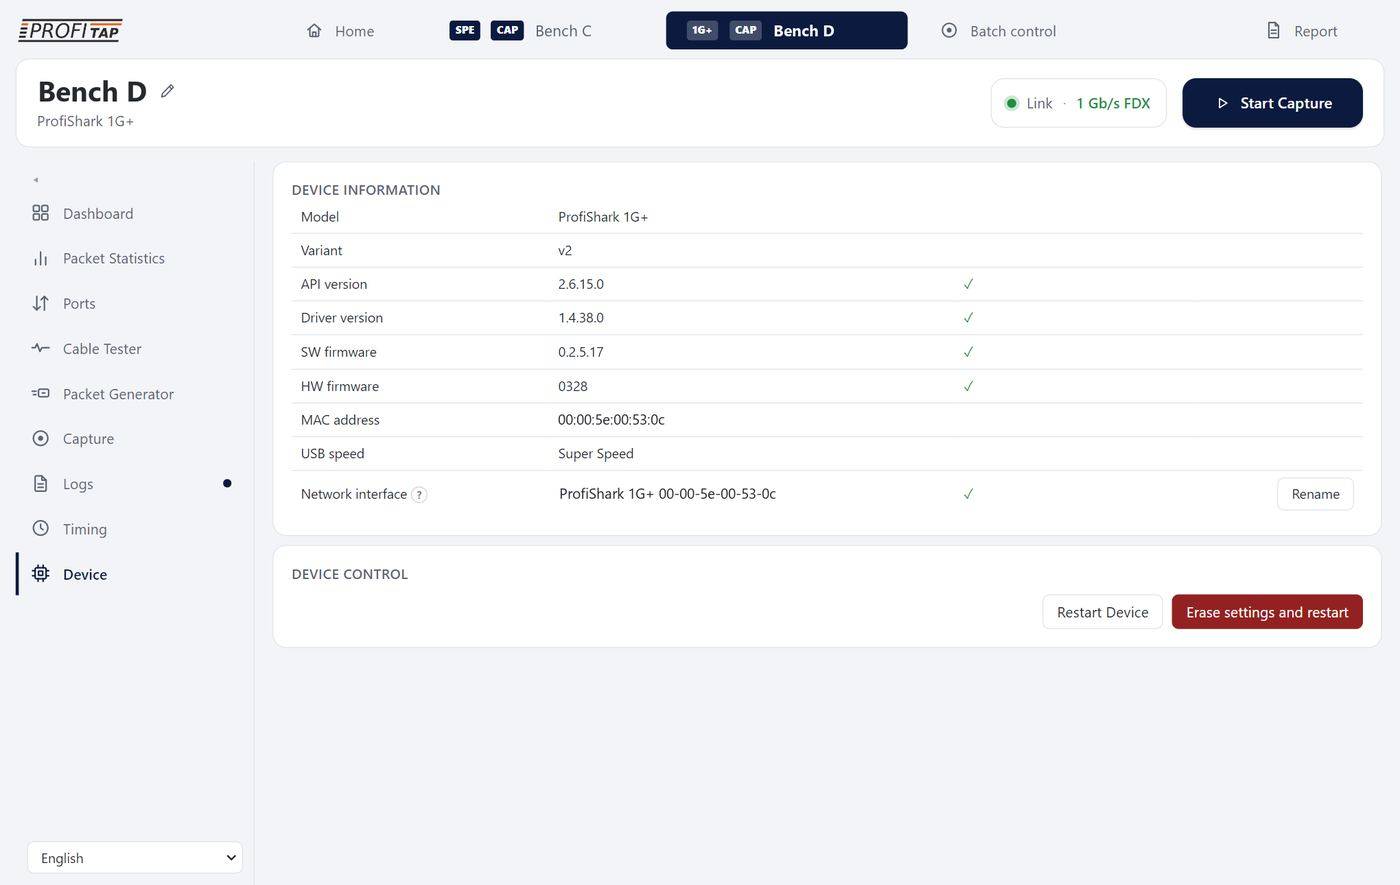
The Device page of a ProfiShark 1G+ (v2): versions, the network connection, and Device control with Restart Device and Erase settings and restart.
DEVICE CONTROL
- Packet Capture, Microburst Detector, Tunnel Termination, Link Scope / Packet Generator and Switch (10G family): writes the other firmware and restarts the unit (section 4.2).
- The 1G family and the SPE have no such switch: they capture always, and their generator is the PHY generator (section 3.17).
- Restart Device, after a confirmation (the link drops while it reboots).
- Erase settings and restart (red): every saved setting goes back to its default — capture options, slicing, SPAN or inline, timestamping, PPS; the model and MAC are kept.
3.15 Licence
10G10G+
What it is for
Give a 10G its feature pack — microburst detection, tunnel termination, Link Scope and the packet generator — kept inside the ProfiShark, so it follows the unit from one computer to another.
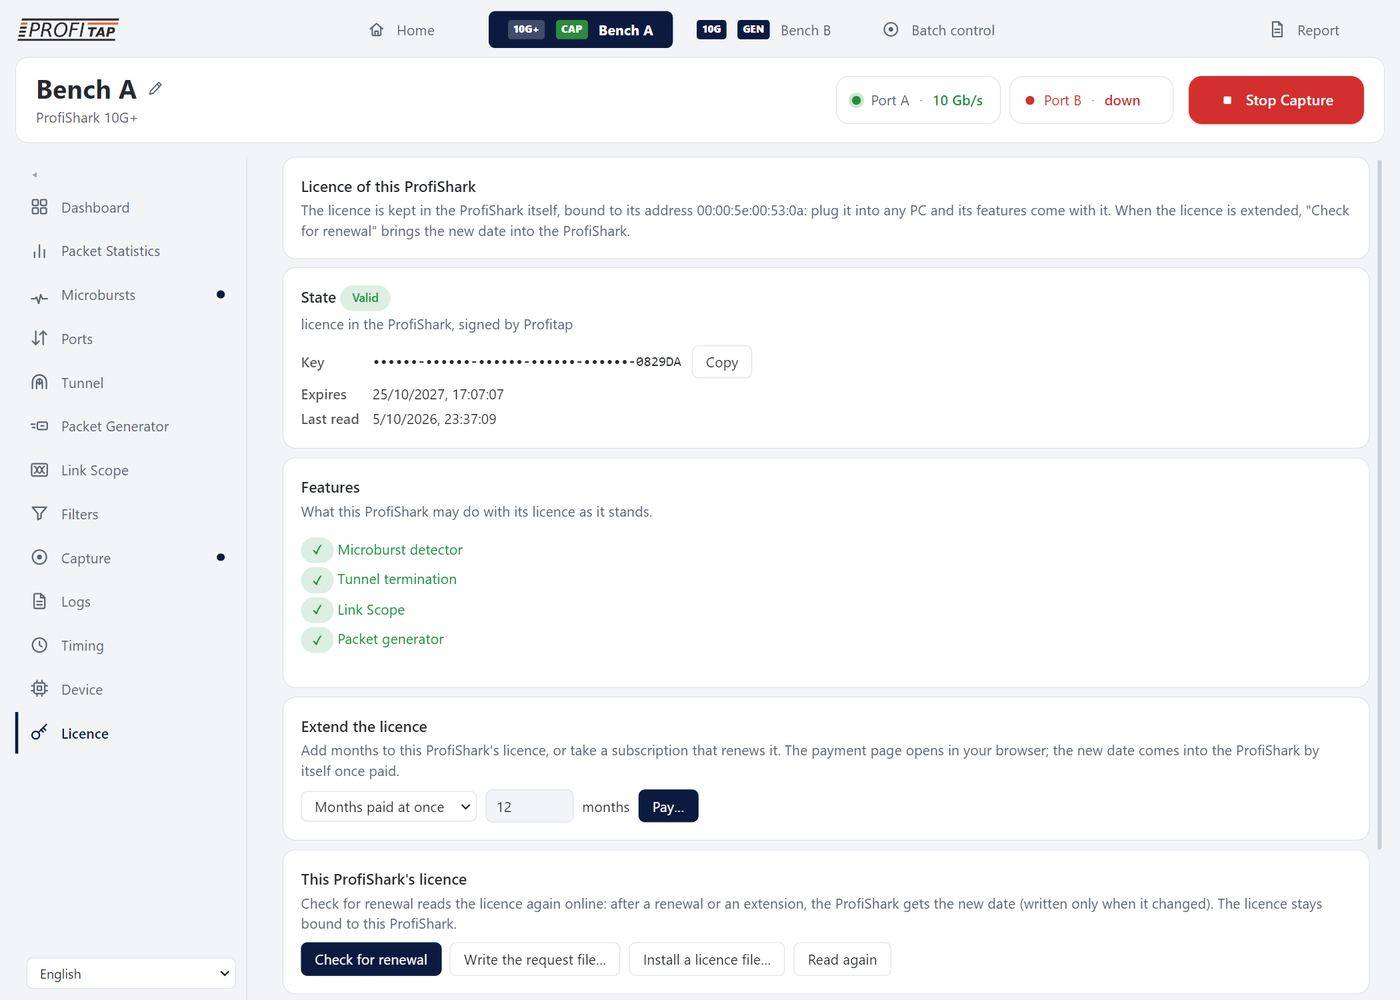
The Licence page: the licence held in the ProfiShark, its state, key and expiry, the features it holds, and how to extend it.
- State: No licence activated, Valid, Subscription expired, Valid but the server not reached lately, Grace period over, Suspended. A chip counts the days left when fewer than seven remain. Key (masked; Copy for support), Expires - the last day: the licence runs until midnight at the end of that day, on this PC's clock -, Last read.
- Features: a ✓ for each feature the licence holds.
- Try it for a month (never activated): Start the trial — every feature for one month, once per ProfiShark, with Internet on this computer.
- Buy a licence / Extend the licence: Months paid at once (no renewal), 1 to 36; or Monthly subscription, renewed every month / Yearly subscription, renewed every year, charged again automatically for one more month or year each time until the subscription is cancelled; Buy… / Pay… opens the payment page in the browser, and the licence comes into the ProfiShark as soon as the payment is done (Stop waiting if you gave up).
- Activate a key: Licence key and Activate online. Once licensed: Check for renewal reads the licence again online. If the licence was withdrawn on Profitap's side, it activates the key again; if the licence no longer exists, it takes it out of the ProfiShark and this computer, so that the trial, a purchase or another key can be used.
- Install a licence file… and Read again (reads the licence in the ProfiShark now).
A ProfiShark on a computer without Internet
- On that computer, Licence page: Write the request file… (with a key, if you have one).
- On any computer with Internet and the Manager, Home or Licence page: Open a request file…, then start the trial, buy, use a key, or (already licensed) Write the licence file…. Save the licence file.
- Back on the first computer: Install a licence file….
3.16 Packet Generator — 10G, 10G+
10G10G+new
What it is for
Test a link, a switch, a firewall or a tap with traffic you control to the bit and to the nanosecond: line-rate loads, real conversations replayed from a capture, shaped traffic, and frames a normal network card cannot send (runts, bad FCS, fragments). The FPGA walks the list by itself, with the same clock that timestamps captures deciding when each frame leaves.
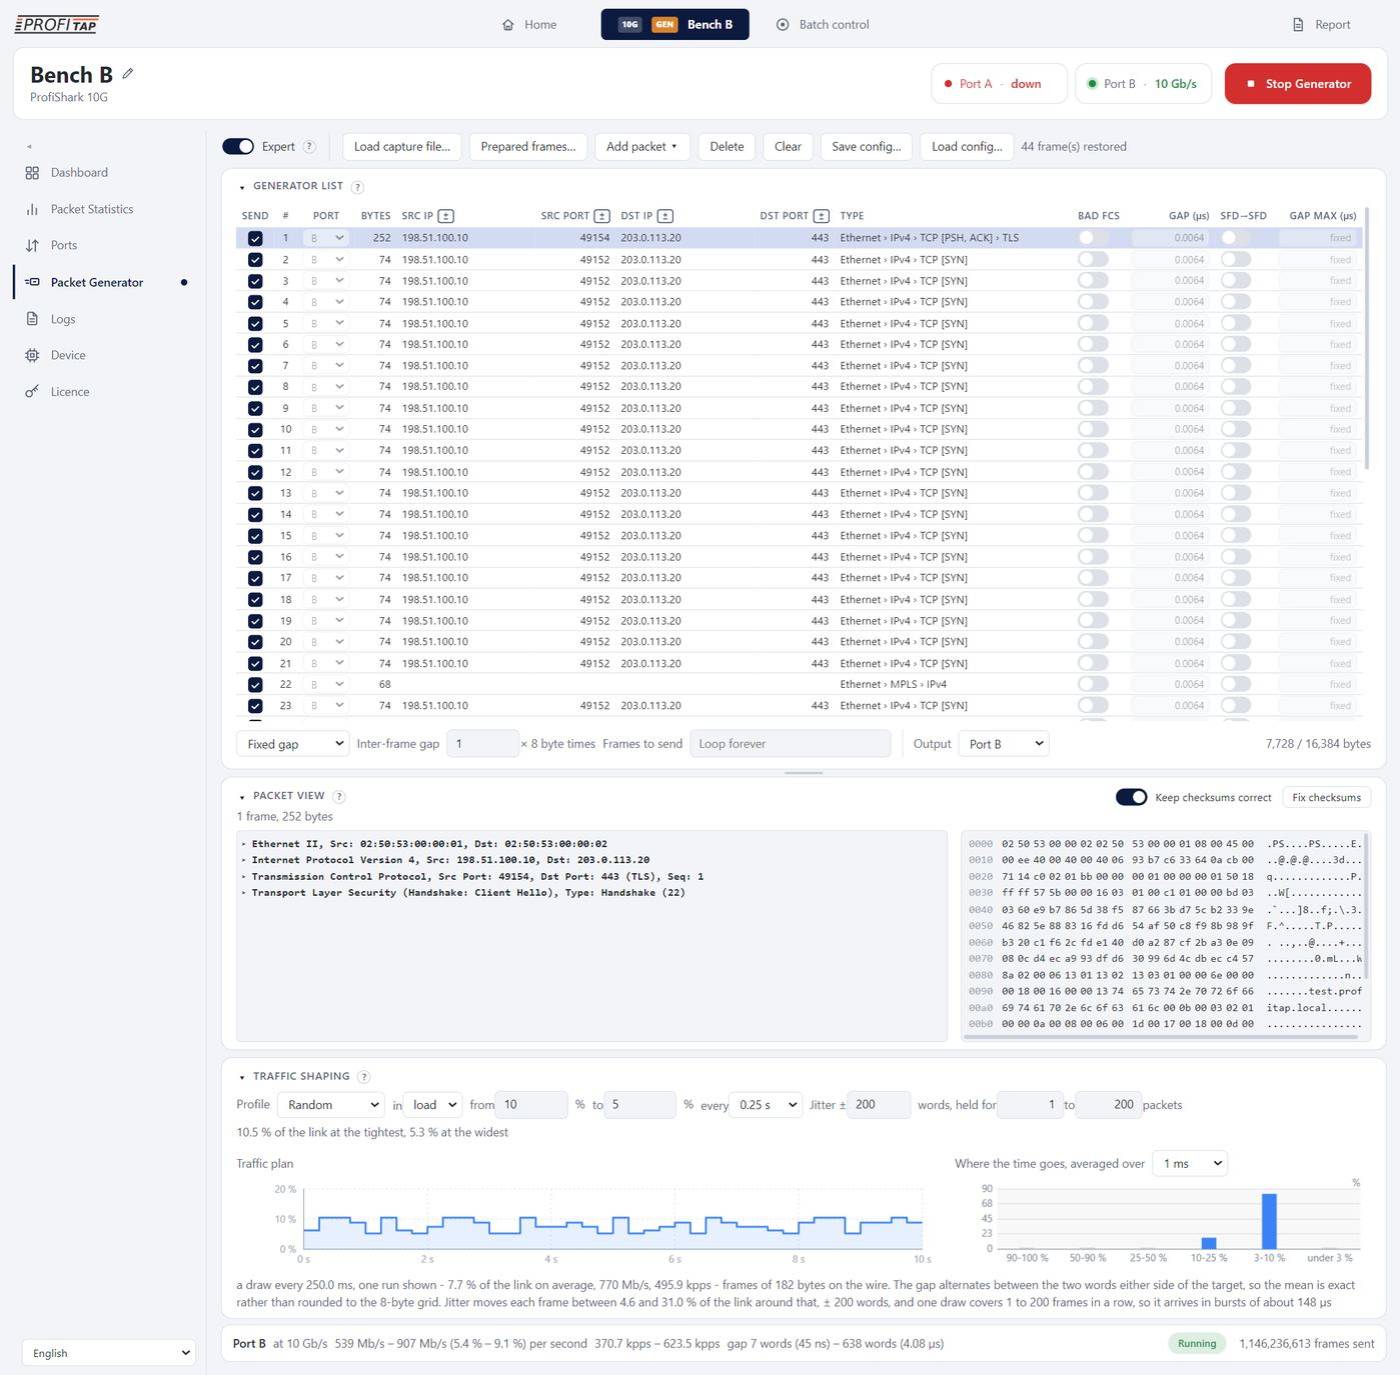
The Packet Generator page of a ProfiShark 10G: the toolbar, the generator list with its address, port and Type columns, Packet View with the selected frame dissected, and Traffic Shaping with its plan.
The page needs the generator firmware (Device page › Device control › Packet Generator › Switch); on the capture firmware it only says so. The generator runs in SPAN mode. Start Generator / Stop Generator are in the device header. Everything on the page is remembered per ProfiShark.
Toolbar
| Control | What it does |
|---|---|
| Expert | Off: frames go out evenly spaced at the inter-frame gap. On: the Traffic Shaping card and the Gap max column appear. |
| Load capture file… | Opens a pcap / pcapng (up to 256 MB) in the frame picker (below). Sliced and oversized frames are skipped; a two-interface capture keeps its ports. |
| Prepared frames… | Fifteen ready-made sets (below): Choose frames opens a set in the picker, Load all replaces the list with it. |
| Add packet ▾ | 242 ready-made frames in 14 categories, with a search box (below). The frame goes after the selection, ready to edit. |
| Delete, Clear | Delete the selected frames, or empty the list (Ctrl+Z undoes). |
| Save config…, Load config… | The whole page in one JSON file: frames, gaps, modifiers, columns, traffic shaping, replay speed, output, PPS start. The same file runs from the command line. |
Loading frames (capture, prepared set, configuration) sends them to the ProfiShark at once; nothing is transmitted before Start Generator.
Prepared frames
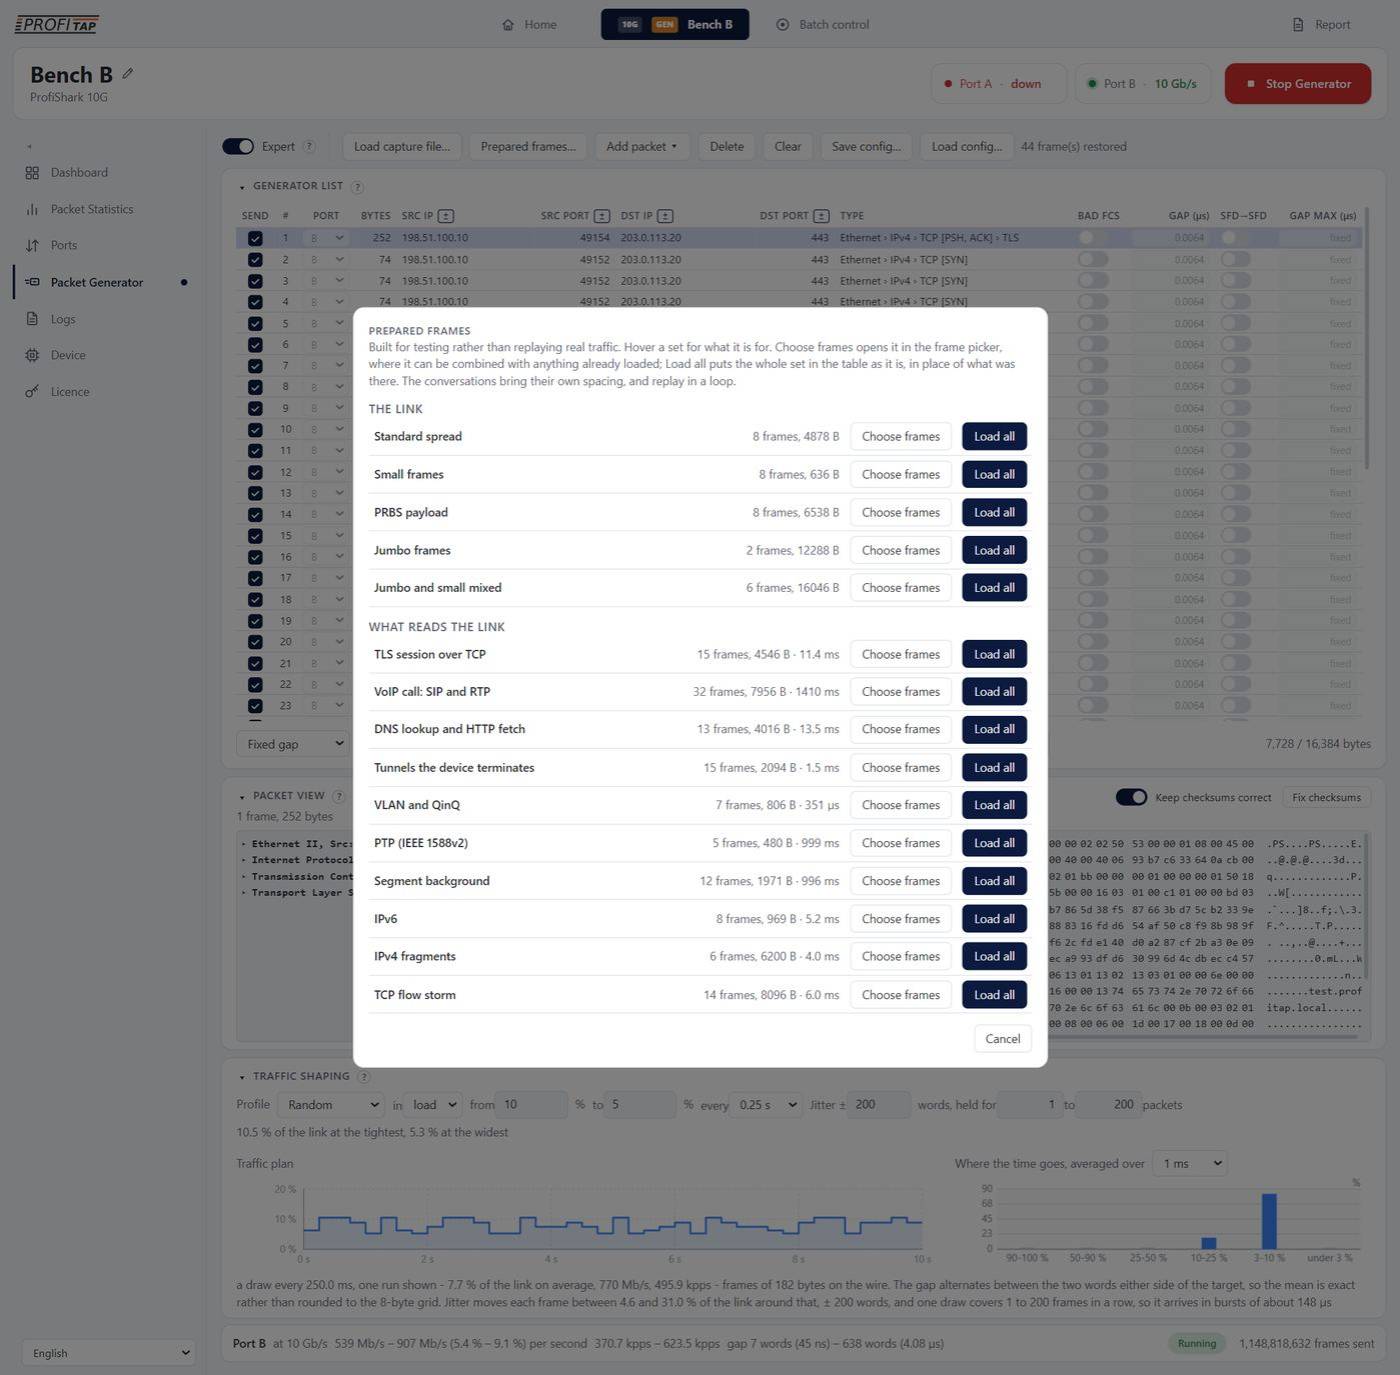
Prepared frames: five sets that qualify the link, ten conversations that qualify what reads it.
The link
Standard spread (8 frames, 64 to 1518 B), Small frames (the highest packet rate), PRBS payload (finds a marginal module or fibre), Jumbo frames (2 KB and 10 KB), Jumbo and small mixed (the worst case for a capture pipeline). They have no timing of their own: the gap you set decides the rate.
What reads the link
TLS session over TCP, VoIP call (SIP and RTP), DNS lookup and HTTP fetch, Tunnels the device terminates, VLAN and QinQ, PTP (IEEE 1588v2), Segment background, IPv6, IPv4 fragments, TCP flow storm (a new flow every loop). Each brings its own spacing and replays in a loop.
Add packet
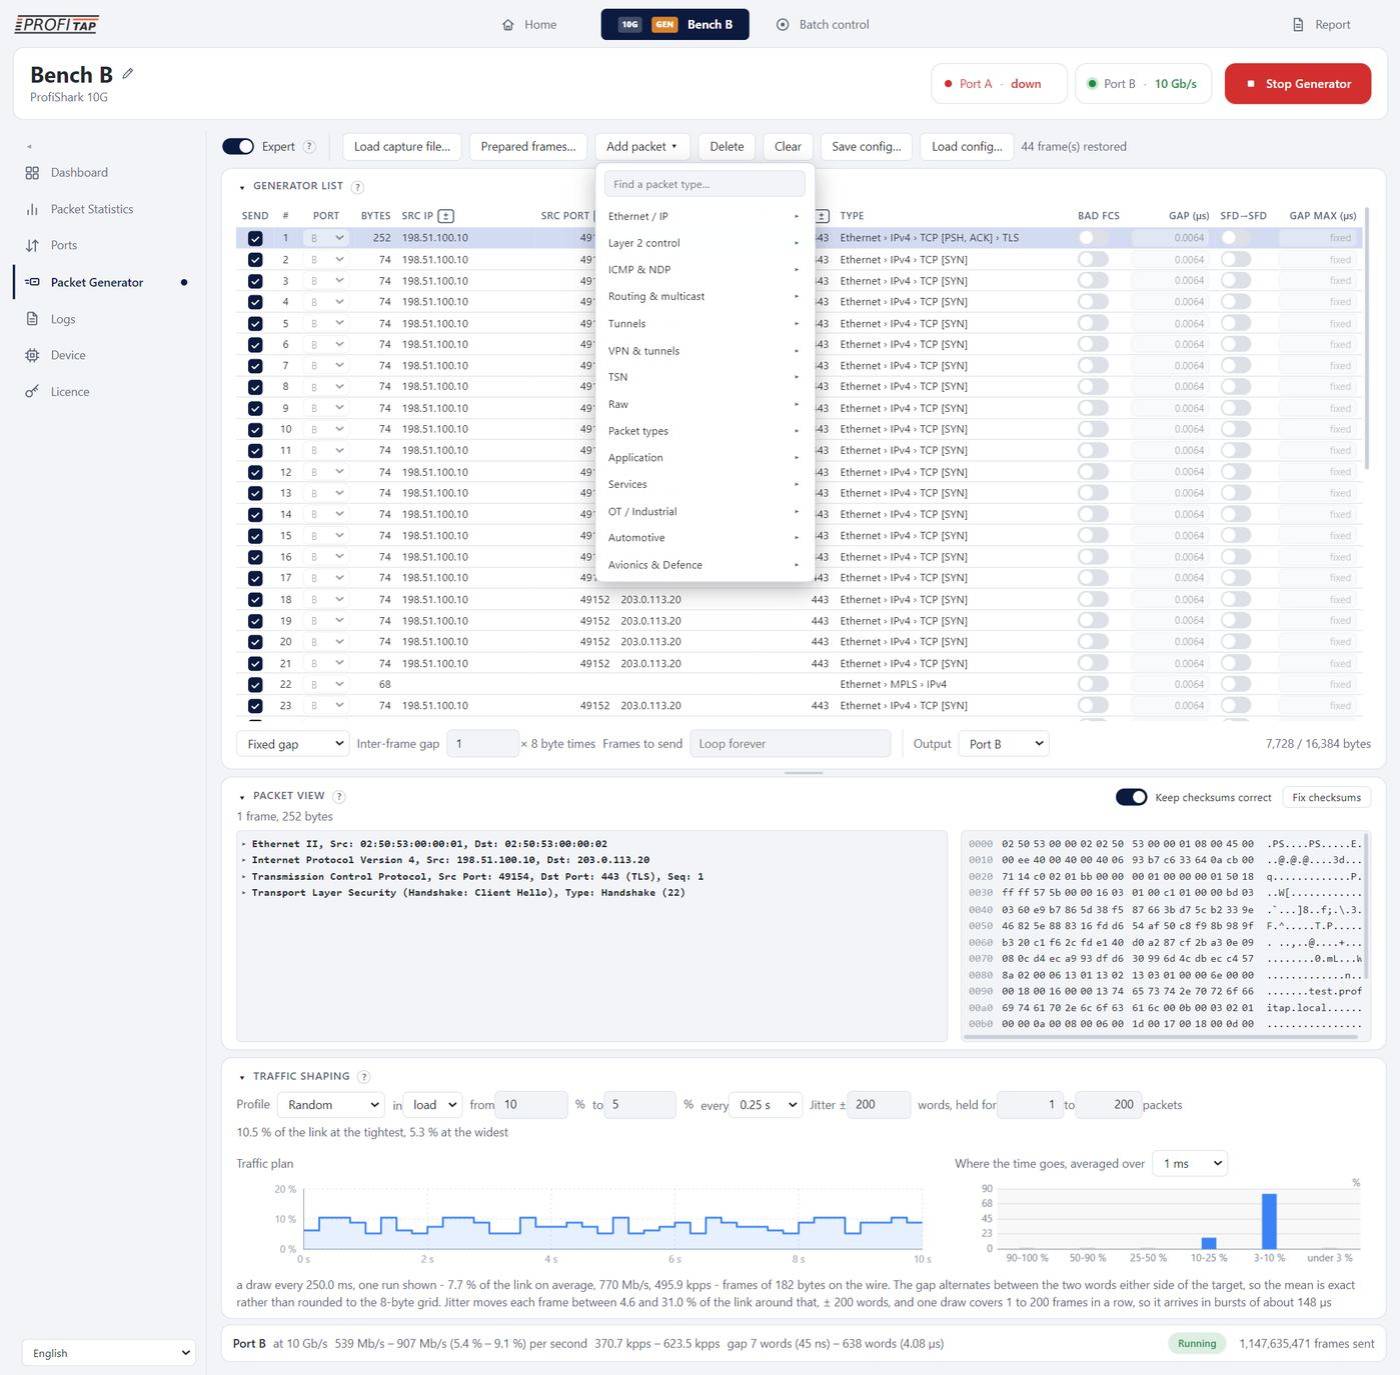
The Add packet menu: a search box and 14 categories, each opening its frames to the side.
Categories: Ethernet / IP, Layer 2 control, ICMP & NDP, Routing & multicast, Tunnels, VPN & tunnels, TSN, Raw, Packet types, Application, Services, OT / Industrial (real-time Ethernet, power and substation, fieldbus over IP, building), Automotive, Avionics & Defence. Typing in Find a packet type… searches every level at once; arrows, Enter and Esc navigate.
The generator list
Frames are sent in the order of the list, up to 255 frames and 16,384 bytes of frame memory (shown under the table).
| Column | Content |
|---|---|
| Send | Untick to keep a frame in the list without sending it. |
| #, Port | Row number; output port A or B (editable with Output set to Per packet). |
| Bytes | Frame size; right-click › Frame size to change it, 10 to 10,236 bytes. Under 60 bytes the frame goes out raw, with its own preamble and FCS: a real runt. new |
| Src IP, Src port, Dst IP, Dst port ± | The addresses and ports, with a badge for their modifier: +1, -1 or rand. on each loop. The ± in their heading marks the columns the ProfiShark itself can vary - at wire speed, with the checksums rewritten - set by right-clicking a cell. Empty for raw and non-IP frames. |
| Type | The whole protocol chain of the frame. |
| Field columns new | Any Packet View field - the IPv4 identification or the TCP sequence number among them: drag it onto the header, or right-click it › Add as a column in the generator list (section below). The × in its heading removes it. |
| Bad FCS | Sends the frame with a wrong FCS. |
| Gap (µs) | The idle time after the frame; a unit may follow the number (ns, µs, ms, s). From 1 word (6.4 ns) to about 440 s. |
| SFD→SFD new | The gap is measured from one start delimiter to the next: the frame's own length is taken off when the list is sent. The gap stays as typed; its tooltip says what goes out after the frame. In Capture deltas as in Fixed gap: there, a gap still read from the capture switches to its start-to-start value, so the frames keep their spacing. |
| Gap max (µs) | Expert: above the gap, the idle time is drawn at random between Gap and Gap max for every frame sent. |
With Fixed gap every frame follows the gap of the port: the Gap and Gap max cells are greyed. Capture deltas gives them back to each row.
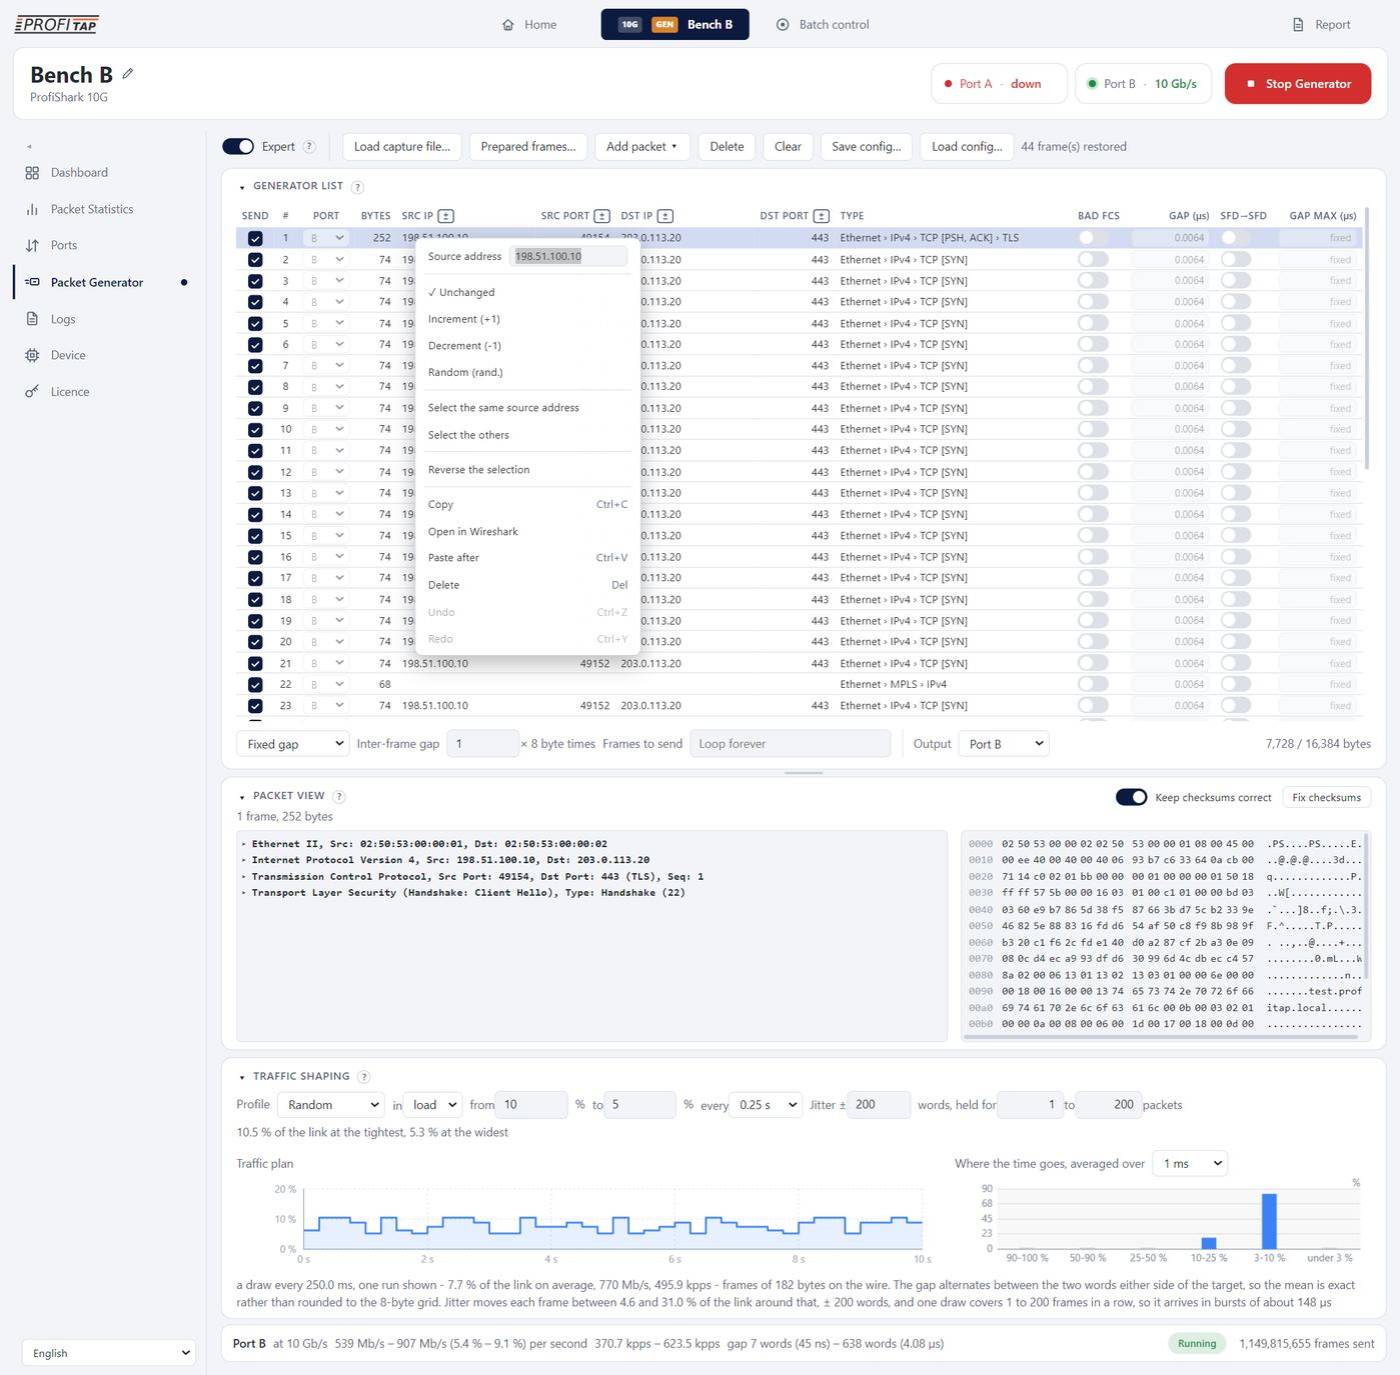
Right-click on a destination address of a selected row: set the address on the selection, its modifier, select the same, copy, open in Wireshark, paste, delete, undo.
Right-click a cell to set it on that row, or on every selected row: send or skip, port A, B or alternate, good or bad FCS, a gap, an address, a port, a frame size, the IP-ID or TCP sequence (with Random, a different one per row), a field value, or the modifier of an address or port (Unchanged, Increment (+1), Decrement (-1), Random). The checksums follow. Then: Select the same …, Select the others, Select all / none, Reverse the selection, Copy, Open in Wireshark, Paste after, Delete, Undo, Redo. Right-click a column header to remove a field column or go back to the Default columns; drag a header to move a column; drag a field from Packet View onto the headers to add one.
- A switch in a row (Send, Bad FCS, SFD→SFD) changes that frame only: it does not select the row nor change the selection.
- The click that closes a context menu, or the click that leaves a field you have just changed, does nothing else: it closes the menu or validates the field, no row is selected and no card folds. Click again to act.
| Keys and mouse | Action |
|---|---|
| Click, Ctrl+click, Shift+click | Select one row, add a row, select a range. |
| ↑ ↓ Home End PgUp PgDn | Move the selection (with Shift: extend it). |
| Ctrl+A new | Select every row. |
| Ctrl+C / Ctrl+V new | Copy the selected frames with all their settings; paste after the selection — into this list, another ProfiShark's, or another Manager. A paste also takes hex streams, one frame a line, such as Wireshark's Copy › as Hex Stream. |
| Delete | Delete the selected rows. |
| Ctrl+Z, Ctrl+Y | Undo, redo — every change on the page. |
| Drag a row | Move it before another row. |
Under the list
- Fixed gap: every frame is followed by the Inter-frame gap (× 8 byte times). Capture deltas: the gaps reproduce the spacing recorded in the capture, divided by Speed × (0.000000001 to 100000; 2 replays twice as fast).
- Send: Free running, At each GPS PPS or At each external PPS (units with the timing board): each second starts one run, its first frame leaving exactly on the second; Lead (in nanoseconds) is how long before the second the frame is launched. The address and port modifiers (increment, decrement, random) carry on from one second to the next: each second continues where the last one stopped, it does not start the list over (generator firmware 0497 and later).
- Frames to send (empty: loop forever; with a PPS: Frames each second).
- Output: Port A, Port B, or Per packet (each frame on its own port). The two ports never transmit at the same instant.
The splitter between the list and Packet View: the list grows to show its rows until Packet View reaches its minimum height, then scrolls; drag the handle to share the height by hand, double-click it for the automatic split.
Packet View
new
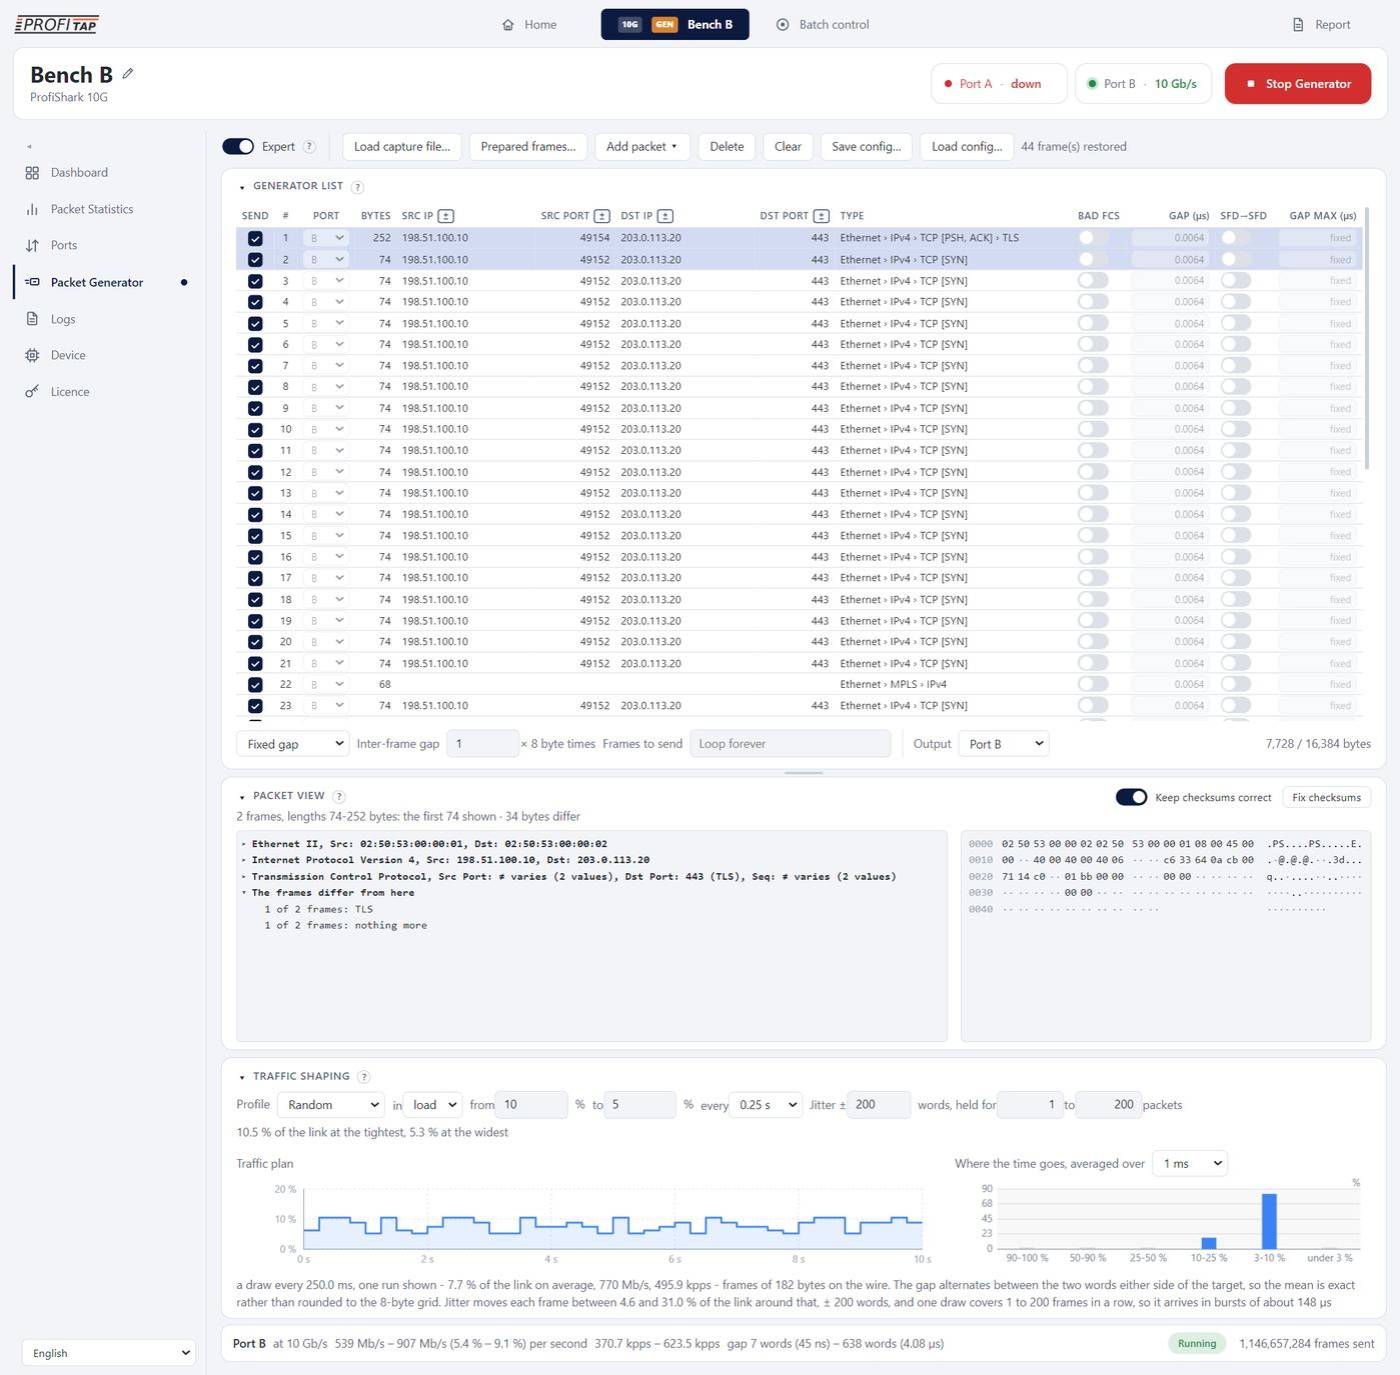
Two frames selected: what they share is shown once, a field that differs reads “≠ varies”, and the bytes that differ show as ··.
The selected frames, taken apart the way Wireshark does: protocols and fields on the left, bytes on the right. Hover a field to light its bytes, or a byte to find its field. With several frames selected, what they share is shown once; a field that differs reads “≠ varies” with its values under the pointer. Packet View folds when nothing is selected. It knows hundreds of protocols, from Ethernet, VLAN, MPLS, IP and TCP/UDP to tunnels (VXLAN, Geneve, GRE, ERSPAN, GTP-U), TSN and preemption, routing, applications, OT and industrial (Modbus, PROFINET, EtherCAT, IEC 61850, DNP3…), automotive and avionics.
- Edit a field: double-click it, Enter applies, Esc cancels; a hex / dec button switches the base. One-bit fields have a switch: a click sets or clears the bit.
- Edit the bytes: click a byte and type hex digits; Insert adds a byte, Delete removes; arrows move, Shift extends.
- An edit goes to every selected frame that has the field. Lengths follow; with Keep checksums correct on, every checksum and the FCS are rewritten (a checksum you typed yourself stays). Fix checksums rewrites them now.
A field as a column of the generator list
new
Any field of Packet View can be watched and set across all the frames at once, as a column of the generator list:
- Press on the field's row in Packet View (its name, not its value) and drag it up onto the header row of the generator list.
- A blue bar shows where the column will go - before or after the heading under the pointer; release there. The Bad FCS, Gap, SFD→SFD and Gap max columns stay at the right: dropped on one of them, the field goes just before them.
- The column shows that field's value in every frame; a frame that does not have the field shows nothing.
The same without dragging: right-click the field › Add as a column in the generator list. In the list, right-click a cell of the column to set the value on that row or on every selected row (the lengths and, with Keep checksums correct, the checksums follow); drag the heading to move the column; the × in the heading, or right-click › Remove column, takes it away. The columns are kept with the page and in Save config….
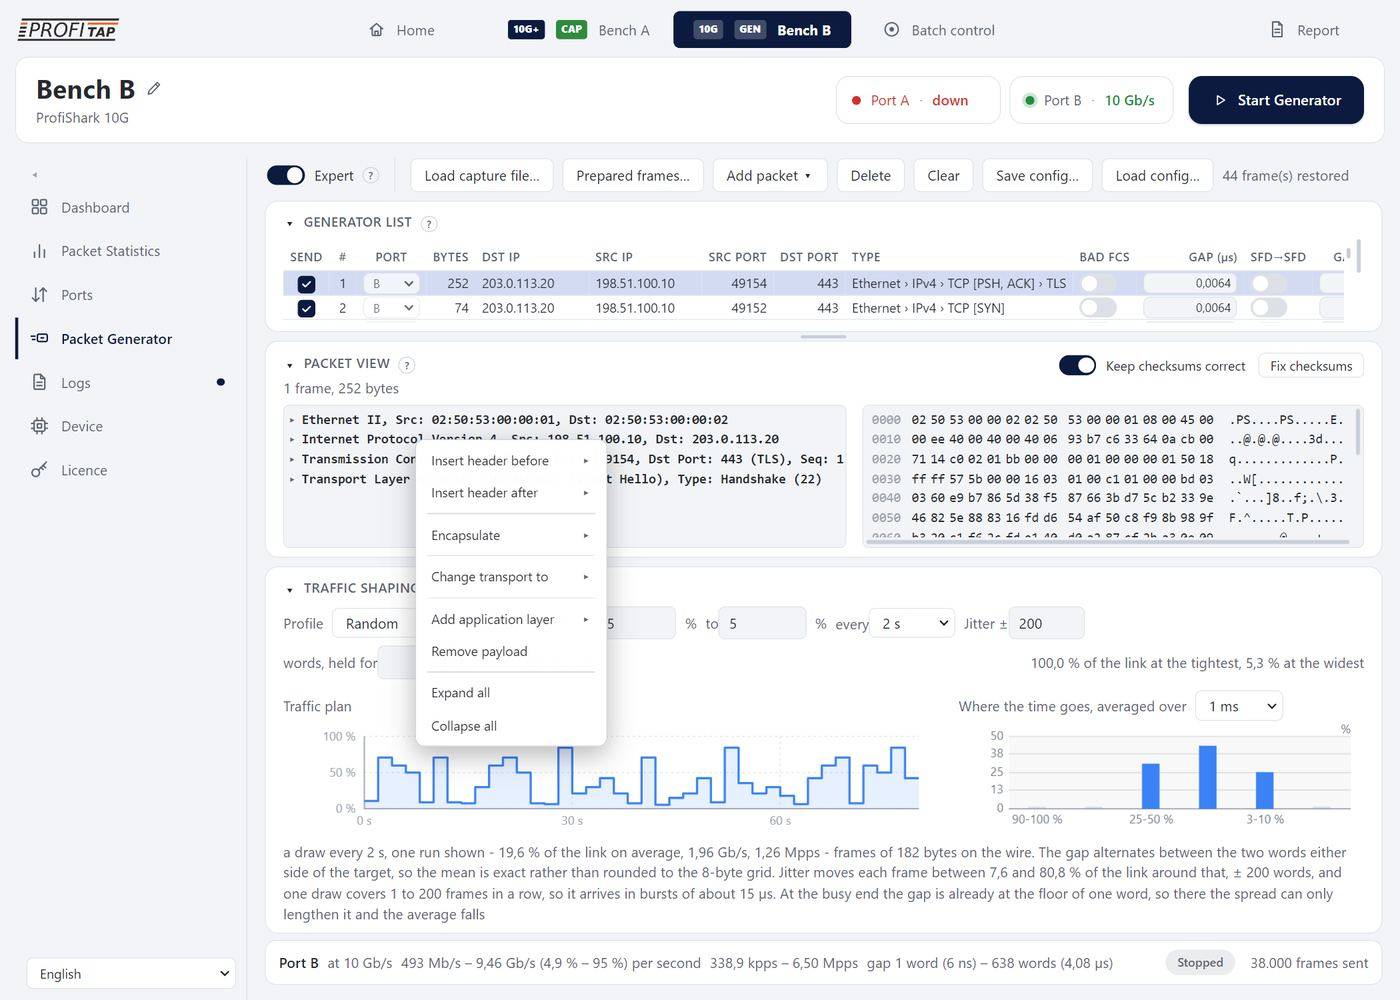
Right-click on the IPv4 layer: insert a header before or after, encapsulate in a tunnel, add a transport or application layer, remove the payload.
| Right-click on | Choices |
|---|---|
| A layer | Insert header before / after (802.1Q VLAN, QinQ, 0x9100 VLAN, 802.1CB R-TAG, MPLS — also in front of IP —, IPv4 Router Alert, IPv6 extension headers, TCP options); Remove this header; Encapsulate (VXLAN, Geneve, GRE, ERSPAN II and III, IP in IP, MPLS); Remove the tunnel encapsulation; Add network layer (IPv4, IPv6) on a bare Ethernet header; Add transport layer (UDP, TCP, ICMP) on IP; Change transport to; Add application layer (the Add packet catalogue, filtered to what fits); Remove payload; Expand all, Collapse all. |
| A field | Its known values (EtherTypes, IP protocols, well-known ports); Set / Clear the bit; Edit…; Copy value; Copy field bytes (hex); Add as a column in the generator list. |
| The bytes | Insert a byte before, Delete the bytes, Copy them in hex, Copy the frame as a hex stream. |
Traffic Shaping (Expert)
The ProfiShark walks the shape itself; a change applies at once, even while sending.
| Control | What it does |
|---|---|
| Profile | Off (the list's own gaps), Flat (holds one value), Random (a new value each step), Sweep (first bound to second, then back to the start), Up and down (reverses instead of jumping back), Square. |
| in load / gap | The bounds as shares of the link (0–100 %, a true 0 % is a pause), or as gaps in 8-byte words. |
| from, to, every | The two bounds, and the length of one step (0.125 s to 10 s). |
| Jitter ± | A random spread, in words, around every gap, on top of the shape; two-sided, so the average stays. |
| held for … to … packets | How many frames in a row share one jitter draw: longer runs make blocks of tight frames — microbursts on purpose. |
The Traffic plan draws the share of the link second by second, and Where the time goes how long the link spends in each load band over windows of 10 µs to 1 s, before anything is sent; a sentence spells out the mean load, rates and burst lengths. The summary bar at the bottom gives, per port, the speed, bit and packet rate ranges, the gap range, the state (Stopped, Loading, Running) and the frames sent.
Unexpected drops downstream? Look at the shaping first: a sweep or random profile varies the load on purpose, down to 0 %.
The frame picker
Used by Load capture file…, Choose frames and frames sent from Wireshark. Left: the frames of the file (#, Bytes, Source, Type, Port); Add selected, Add as many as fit, or double-click a frame. Right: the list to send, which starts with what is already loaded so several files can be combined; drag to reorder, choose each frame's port, ✕ to remove, Clear list. OK replaces the generator list; Cancel changes nothing.
3.17 Packet Generator — 1G family and SPE
1G+ v21G v61G v7SPE
What it is for
Turn the ProfiShark into a link tester: its PHY builds frames and sends them to the link partner, and the capture engine counts what comes back — a quick check of a link, a cable or a far-end loopback without a traffic generator.
1G family
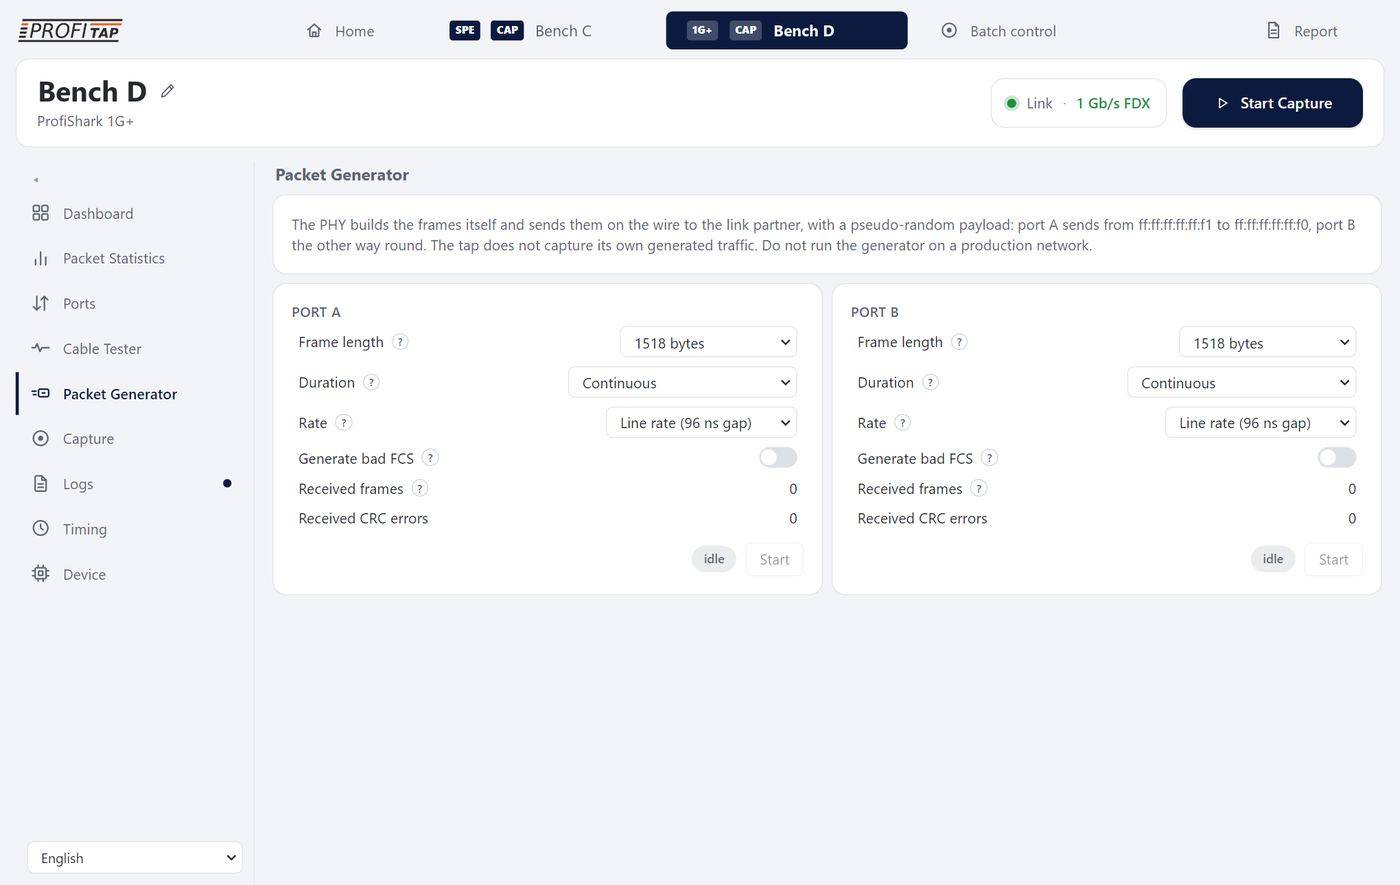
The PHY packet generator of a ProfiShark 1G+: frame length, duration, rate and bad FCS per port, with the frames and CRC errors received.
The PHY builds pseudo-random frames: port A sends from ff:ff:ff:ff:ff:f1 to ff:ff:ff:ff:ff:f0, port B the reverse. The tap does not capture its own generated traffic.
| Setting (per port) | Choices |
|---|---|
| Frame length | 64, 125, 1518 (default) or 10000 bytes (jumbo) — the lengths the PHY implements. |
| Duration | Continuous (default), or 30 000 000 frames then stop. |
| Rate | Line rate (96 ns gap) or Low rate (8192 ns gap). |
| Generate bad FCS | Every frame with a wrong checksum: tests that the far end counts and drops them. |
Readouts: Received frames (counted by the capture engine on this port since the last start) and Received CRC errors (red when not zero). The chip reads idle or running; Start / Stop per port, and the options are locked while it runs.
SPE
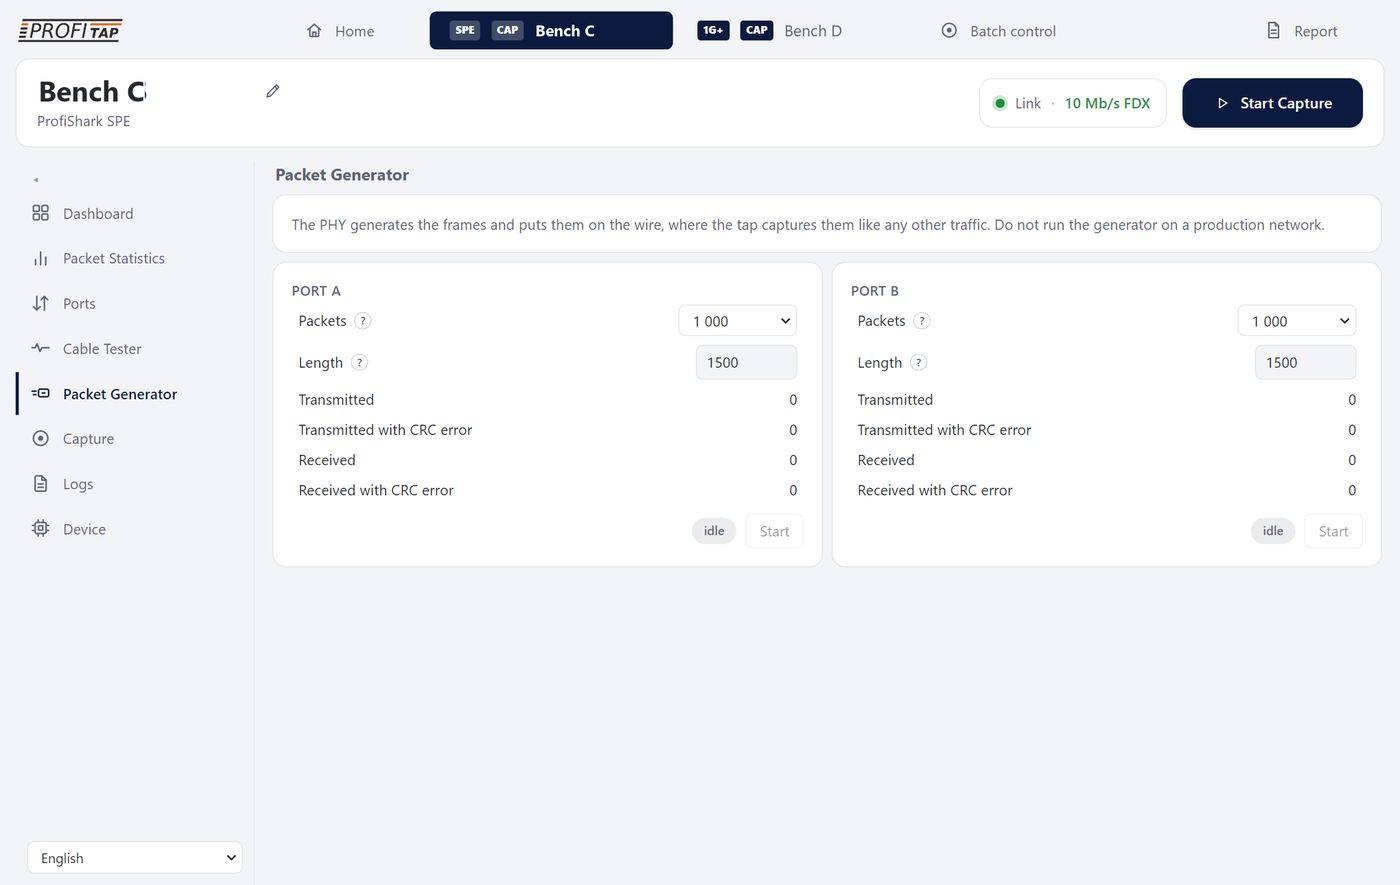
The packet generator of a ProfiShark SPE: number of packets and length per port, with what was transmitted and received.
| Setting (per port) | Choices |
|---|---|
| Packets | 1, 10, 100, 1 000 (default), 10 000, 100 000, 1 000 000, or Continuous. |
| Length | 46 to 1500 bytes (default 1500). |
Readouts: Transmitted, Transmitted with CRC error, Received, Received with CRC error. Start / Stop per port.
Not on a production network. The generator is refused while the tap is inline (“Not while the tap is inline: generating would inject into the live link”): set SPAN mode on the Ports page first.
4. Firmware: update, switch and recovery
What it is for
Keep every ProfiShark on the firmware its features need, change the role of a 10G between capture and generation, and bring back a unit whose firmware was damaged — all from the Manager, without a separate tool and without returning the unit.
The firmware images travel inside the Manager: one device (SW) firmware for every model, and per-model FPGA (HW) firmware — on the 10G family, one for capture and one for the generator. They are sealed: the Manager opens an image only for the length of a write, and refuses one that was altered. There is never a file to choose.
4.1 Updating the firmware
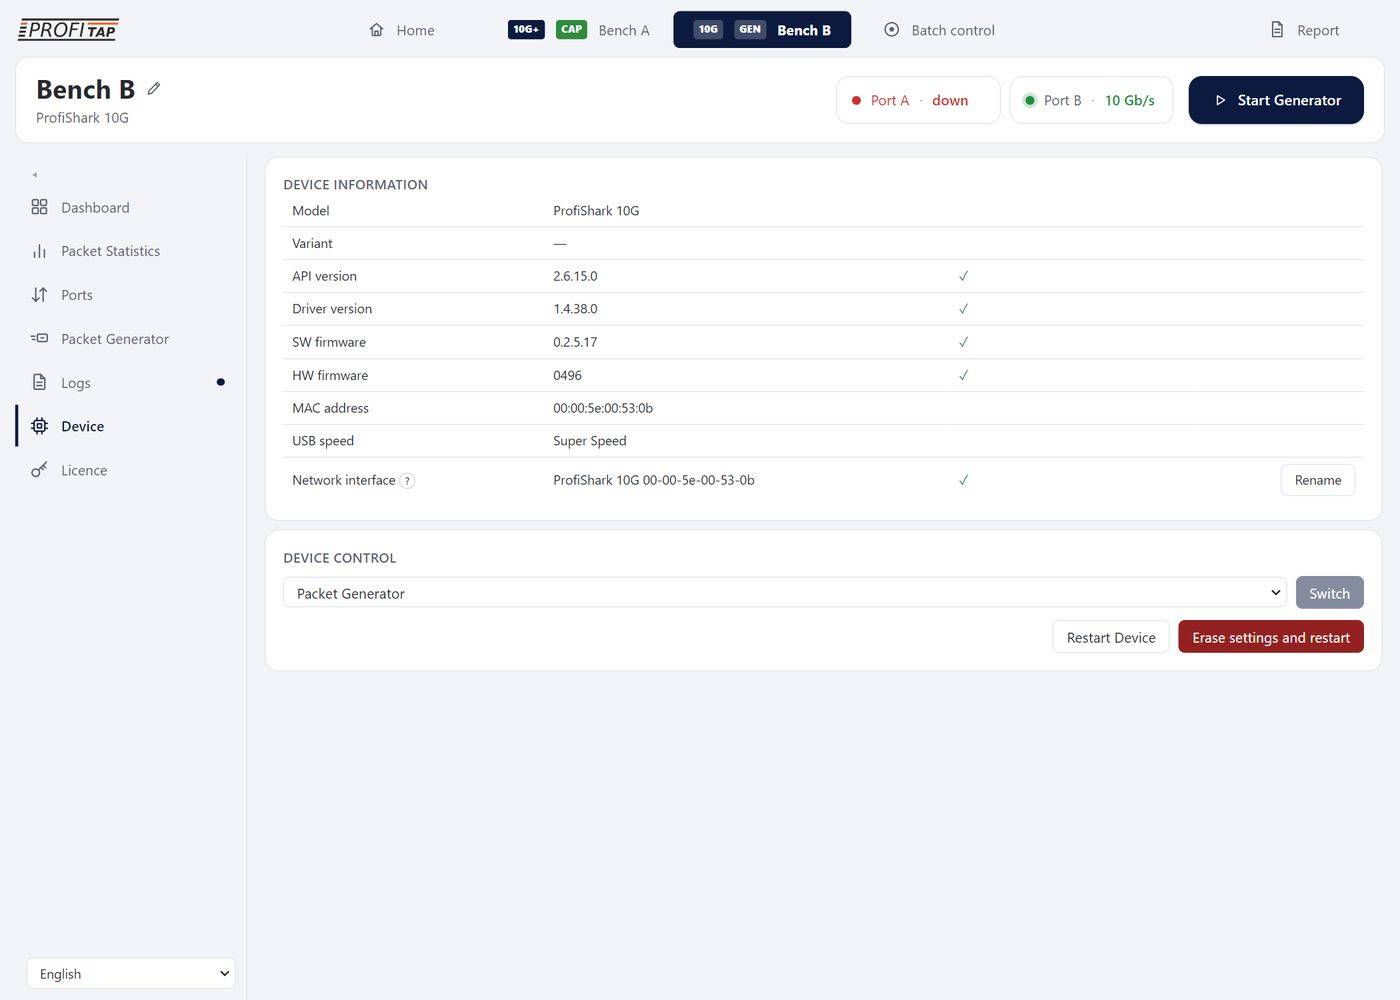
The Device page of a ProfiShark 10G in generator mode: every version with a green tick, and Device control with Packet Generator selected.
When an update is needed
- The Manager compares each unit with the versions it needs. When something is behind, the menu shows only Device, the UPDATE REQUIRED card lists what is behind, and Start is greyed (“Update the device first: see the Device page.”).
- SW firmware: “needs x” and Update when it is older than required.
- HW firmware: “needs x” and Update when the Manager carries a newer image for the role the unit runs (a 10G in generator mode is compared with the generator image, so an update never changes its role).
- HW firmware 0000: a unit whose FPGA flash holds no image yet new. It cannot say which product it is (the Model reads “ProfiShark (0x4a)”), so the row reads “needs a bitstream” and offers a list, Which product is it?, with the HW firmware of each model, and Write. Pick the model on the unit's label: the Manager asks to confirm, writes it like an update and restarts the unit, which then comes back as its model with every page. The wrong model's firmware leaves a unit that captures nothing and no longer offers the list: check the label before writing, and contact Profitap support if it happened.
- API version, Driver version: no button — they come with the ProfiShark software; install the newer software package.
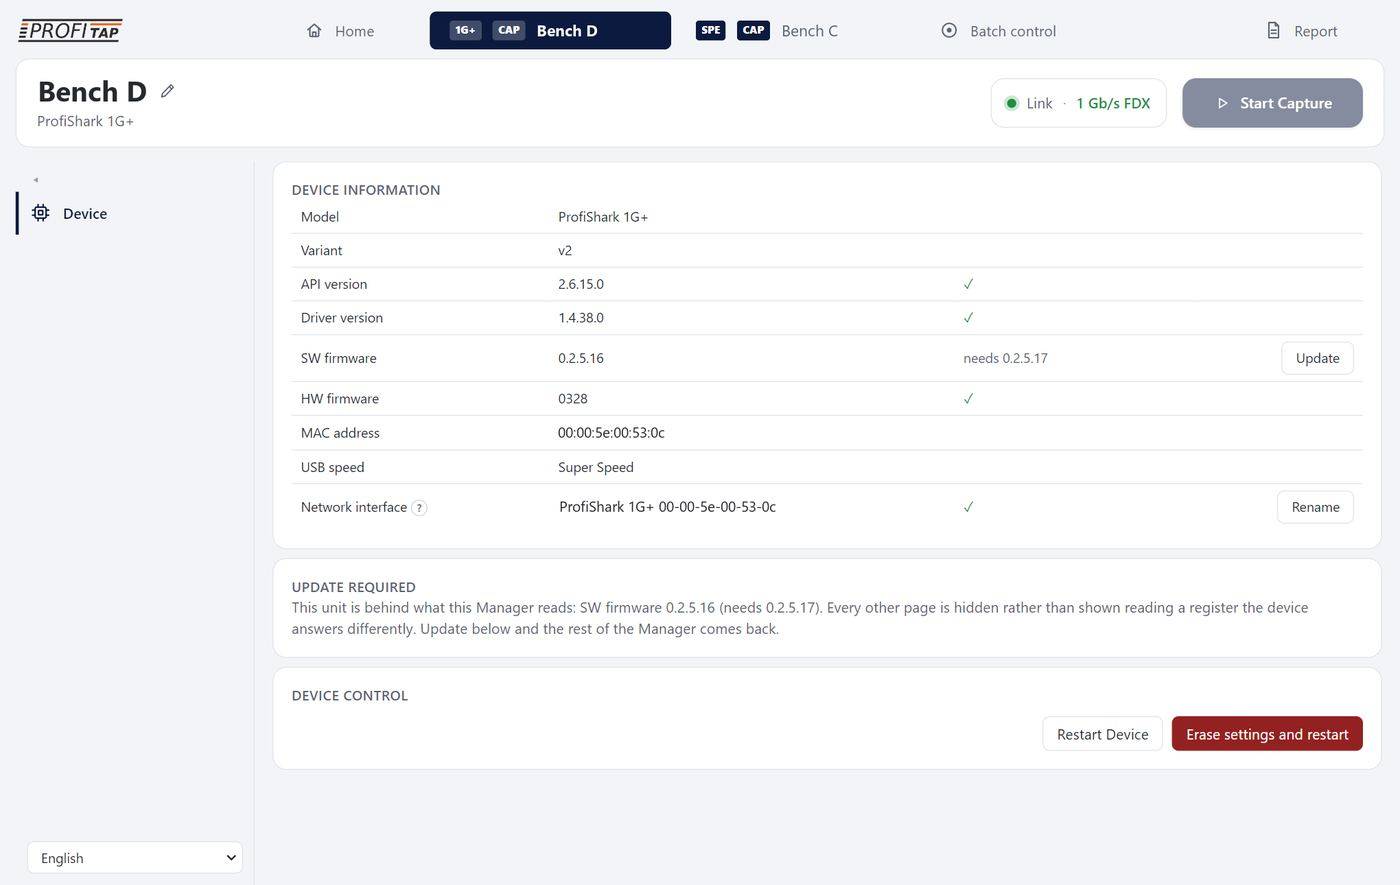
A ProfiShark 1G+ whose device firmware is behind: the menu shows only Device, the SW firmware row says “needs 0.2.5.17” with Update, and the UPDATE REQUIRED card explains.
Step by step
- On the Device page, click Update on the row. A progress bar replaces “needs x”. The row reads ”erasing the flash…“ first (the bar stays empty for up to about 30 seconds while the flash is erased), then ”writing…“ as the bar fills new. The window is locked while the flash is written: do not unplug the ProfiShark.
- When the image is written the row reads “written — restarting…”: the unit restarts on the new firmware. The window goes to Home while it is away, then back to the Device page when it returns (up to about 25 s).
- ”done — restarted on the new firmware“: the row shows ✓; if nothing else is behind, every page comes back. When both firmwares are behind, update one row, then the other.
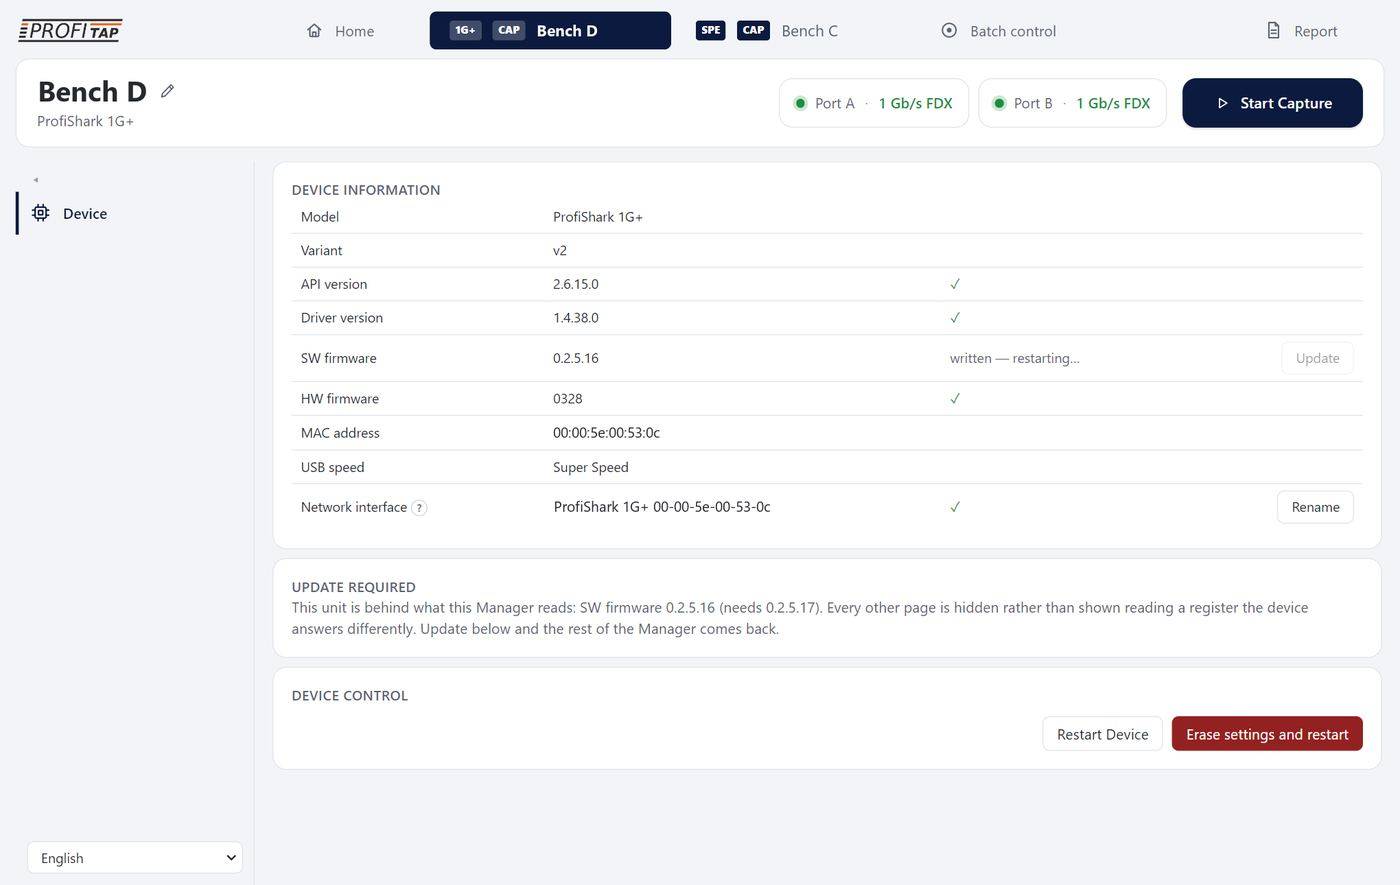
The same 1G+ during the update: the progress of the write in the SW firmware row. It came back on 0.2.5.17 with every page.
A 10G FPGA image takes about 30 seconds to write new.
| Message | What to do |
|---|---|
| the device refused it / this model does not support the update / that file is not an update container for this model | The unit is not the model the image is for, or refused the write: contact Profitap support with the Device page in a report. |
| the device went away | It left the bus during the write, or stopped answering for 60 s: keep it plugged in, and update again. |
| written, but it did not come back - power-cycle the unit | Unplug and replug the ProfiShark. |
| written, but it came back in its boot loader - use Recover firmware above | Recover it (section 4.3). |
4.2 Switching a 10G between capture and generator
A 10G or 10G+ runs one of two FPGA firmwares. Packet Capture: everything except the packet generator. Packet Generator: the generator and the packet statistics; the capture pages disappear, the tab shows GEN and the header button becomes Start/Stop Generator.
- Device page › DEVICE CONTROL: choose the other firmware in the list, then Switch.
- Confirm: “Write the generator HW firmware into the unit and restart it? It takes up to two minutes.” (or the capture one).
- A progress bar runs through preparing the flash, writing, and the restart, while the unit is off the bus. The window is locked meanwhile.
- The unit comes back on the new firmware (the Manager waits up to 90 s): the list shows the new firmware and the pages change to match.
If the unit comes back on the old firmware the bar turns red with “back, but still on the … firmware: switch again”.
4.3 Recovering a ProfiShark whose firmware is damaged
A ProfiShark whose device firmware is blank or damaged (a power cut during an update, for instance) starts as a bare USB boot loader: it is not a ProfiShark yet, so it gets no tab. The Manager notices it and shows a banner above the tabs:
| Banner | Meaning |
|---|---|
| ”A ProfiShark is waiting in its boot loader: its firmware is blank or damaged.“ + Recover firmware | It can be recovered from here. |
| ”A ProfiShark is waiting in its boot loader, but the boot loader's driver is not installed: reinstall the ProfiShark software, then unplug and replug the unit.“ | The boot loader's USB driver is missing; it comes with the ProfiShark installer. |
- Click Recover firmware. “booting…”: the Manager loads the device firmware into the unit's memory (not its flash).
- “booted — waiting for it to come back…”: the unit restarts from memory and appears again (up to 20 s).
- “booted — writing the firmware to its flash…”: the normal update writes the same firmware into the flash, then restarts the unit.
- ”recovered — the firmware is in its flash and will survive a power cycle“. The unit appears as a normal tab. The whole recovery takes about one minute.
| Message | What to do |
|---|---|
| the boot loader is no longer on the bus - replug the unit and try again | Replug, then Recover firmware again. |
| the board refused the download / the board did not take the image | Replug and try again; if it persists, contact support. |
| the ProfiShark library is not answering - restart the Manager and try again | Close and restart the Manager. |
| booted, but it did not reappear on the bus - replug it, then update its firmware | The unit runs from memory only: once it is listed, update its SW firmware on the Device page, or it returns to the boot loader at the next power cycle. |
Recovery works on Windows, Linux and macOS. On macOS new it needs no extra driver or software: the Manager reaches the boot loader directly.
From the command line: recovery status, recovery boot <image>, then update --sw <image> (section 6).
5. Wireshark integration
What it is for
Use Wireshark as the ProfiShark's own analyser: capture live with the unit's hardware settings, read its statistics and microburst records, and send what you see straight back to the generator.
Wireshark and the Manager now work as one tool. Wireshark captures live from a ProfiShark with the unit's own settings, reads everything a ProfiShark writes into a file, and hands packets back to the Manager's generator; the Manager opens captures, live captures and microburst events in Wireshark.
5.1 The four pieces, installed from Home
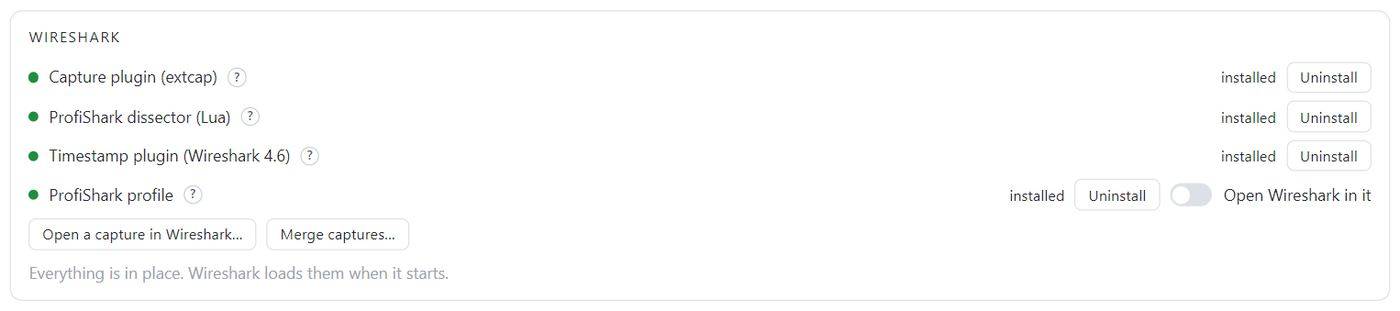
The Wireshark card on Home: the four pieces installed, the profile switch Open Wireshark in it (off), and the buttons to open or merge captures.
The Wireshark card on the Manager's Home page shows each piece with its state and an Install, Update or Uninstall button. No administrator rights are needed (the pieces go into your personal Wireshark folders) and they survive a Wireshark upgrade. Install them after Wireshark if Wireshark came later. On Windows the Manager finds Wireshark wherever its installer put it, on any drive new.
| Piece | What it gives |
|---|---|
| Capture plugin (extcap 1.5) | The ProfiShark in Wireshark's interface list, with its own capture options and a toolbar (section 5.4). |
| ProfiShark dissector (Lua) | Decodes the blocks a ProfiShark writes (clock, per-port counters, microburst records), the Expert Information, the “seen twice” latency, and the ProfiShark menus. |
| Timestamp plugin | On Windows, Linux and macOS new, a capture on the ProfiShark's own network adapter shows the hardware timestamp in Wireshark's Time column. Built for each Wireshark branch (4.2, 4.4, 4.6 and 5.0, and older branches on Linux; on macOS for Apple silicon and Intel); the Manager installs the one matching your Wireshark. |
| ProfiShark profile | A Wireshark configuration profile named ProfiShark: columns, filter buttons and colours (section 5.2). Its switch Open Wireshark in it (off by default) makes the Wireshark opened from the Manager use it. |
On macOS the installer links the capture plugin into ~/.local/lib/wireshark/extcap. From the command line: wireshark status, wireshark install, wireshark update, wireshark uninstall.
After updating the Manager, open Home › Wireshark and update each piece so that Wireshark gets the new plugin, capture plugin and profile.
5.2 The ProfiShark profile
Wireshark started from the Manager stays in the profile you work in: your own columns and settings are left alone. To have it open in the ProfiShark profile, turn on Open Wireshark in it on its row of the Home › Wireshark card. At any time you can also choose ProfiShark in the profile area at the bottom right of Wireshark's status bar.
In a merge of two ProfiShark captures, the frames of both ProfiSharks show their port in the Port column, and the Port A / Port B buttons select that port on both.
Columns
- Port: A or B, the ProfiShark port the frame came in on.
- Time: absolute date and time to the nanosecond.
- Seen before: the time since the same frame was seen on another interface (section 5.7).
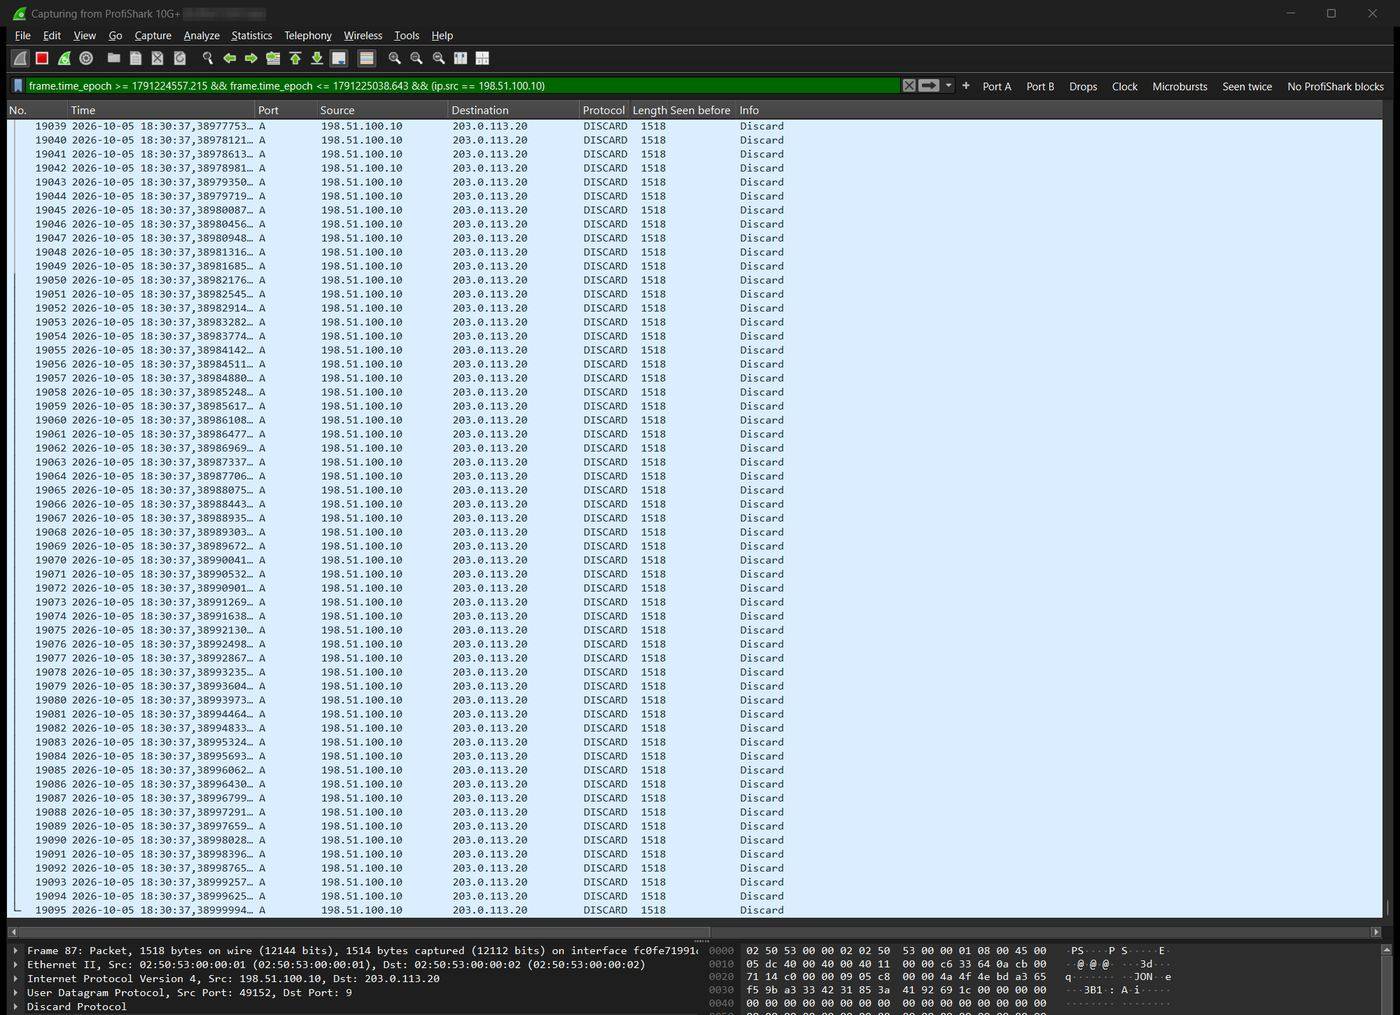
Wireshark capturing live from a ProfiShark 10G+ with the ProfiShark profile: the Port column, nanosecond timestamps and the filter buttons on the right of the filter bar; the display filter is the one sent by the Microbursts page of the Manager.
Filter buttons
| Button | Display filter | Shows |
|---|---|---|
| Port A | profishark_blocks.port_letter == "A" || profishark_blocks.port == 0 | Frames and blocks of port A. |
| Port B | profishark_blocks.port_letter == "B" || profishark_blocks.port == 1 | Frames and blocks of port B. |
| Drops | profishark_blocks.expert.dropped | Seconds in which the ProfiShark dropped frames. |
| Clock | profishark_blocks.expert.pps_lost || profishark_blocks.expert.free_running | Seconds in which the clock lost its PPS or ran free. |
| Microbursts | profishark_blocks.mb.start_ns | Every recorded burst. |
| Seen twice | profishark_blocks.match.delta | Frames seen on two interfaces. |
| No ProfiShark blocks | !profishark_blocks.subtype | The traffic alone, without the ProfiShark's statistics and records. |
Colours mark what the ProfiShark reports (drops, clock problems, microbursts), on top of Wireshark's own colouring rules.
5.3 Reading ProfiShark blocks
A ProfiShark capture contains, besides the frames, blocks under Profitap's IANA enterprise number. The dissector turns them into readable rows in the packet list, protocol ProfiShark blocks:
- Per-second statistics per port: frames received, kept by the filter and dropped (cumulative since the start of the capture), with the moment.
- Clock state: disciplined to a PPS, GPS or external PPS present, GPS fix, time set by the host, where the time was initialised from, deviation from the PPS in picoseconds.
- Microburst records (with the Capture option on): per port and per second, bursts, bytes, packets, backlog peak, time at line rate; each burst with its start (ns since the epoch), duration and senders (MAC, IPv4, IPv6).
- Each block carries the interface of the port it describes, so one display filter keeps a port's frames and everything measured about them together.
Expert Information
Analyze › Expert Information lists what the ProfiShark itself reported: The ProfiShark dropped frames, The ProfiShark's clock lost its PPS, The ProfiShark's clock is free running, and each Microburst.
Filter on this burst
Right-click a microburst record › ProfiShark › Filter on this burst: the display filter is set to the frames of that burst (its start and duration, a millisecond either side), without the ProfiShark blocks. Press Enter to apply it. The entry appears only on microburst records.
Drops in Capture File Properties
At file close the driver writes one Interface Statistics Block per port; Statistics › Capture File Properties then shows the frames dropped per interface.
5.4 Live capture from Wireshark
With the capture plugin installed, every ProfiShark appears in Wireshark's interface list as ProfiShark <model> (<MAC>). Click the gear beside it for its options, in tabs:
| Tab | Options |
|---|---|
| Capture | Keep CRC field, capture CRC errors, slicing and its length, disable port A or B, raw frames, no statistics blocks. |
| Timestamps | Set the ProfiShark's clock at the start: leave it, from this computer's clock, or from the GPS as soon as it has the time. |
| Hardware filter | IP address, TCP/UDP port and MAC address (either way, source or destination), VLAN ID, content match of up to 16 bytes (hex). |
| Features | Microburst detector (as it is, on, off) and Microburst records in the capture. |
Everything is put back as it was after the capture. If Wireshark is closed during a capture, the plugin stops the ProfiShark's capture, restores its settings and frees it for the next program.
The ProfiShark toolbar
View › Interface Toolbars › ProfiShark while a capture runs:
- The link, speed and frame count of each port.
- A Note field and Mark event: writes a marker with the note into the capture (filter
frame.comment). - Slicing and ports A / B switched live; a log.
The Manager sees the capture (section 3.10): the tab turns green, the Capture page shows the counters and the capture strip fills.
5.5 From Wireshark to the Manager
The dissector adds a ProfiShark menu in two places. Each one starts the Manager (or brings the open one forward) and hands it the packets in a temporary capture file.
| Menu | What it does |
|---|---|
| Tools › ProfiShark › Send displayed packets to the generator | Every packet the display filter keeps, with its timestamps for a faithful replay. |
| Tools › ProfiShark › Send displayed packets to the generator - port A or B by direction | For a conversation (apply Wireshark's Conversation Filter first): the side that spoke first goes out on port A, the other on port B, so the exchange replays through a device placed between the ports. |
| Right-click a packet › ProfiShark › Send this packet to the generator | That one packet. |
| Right-click a packet › ProfiShark › Edit this packet in the ProfiShark Packet View | The packet lands in the generator list, selected in Packet View, ready to edit. |
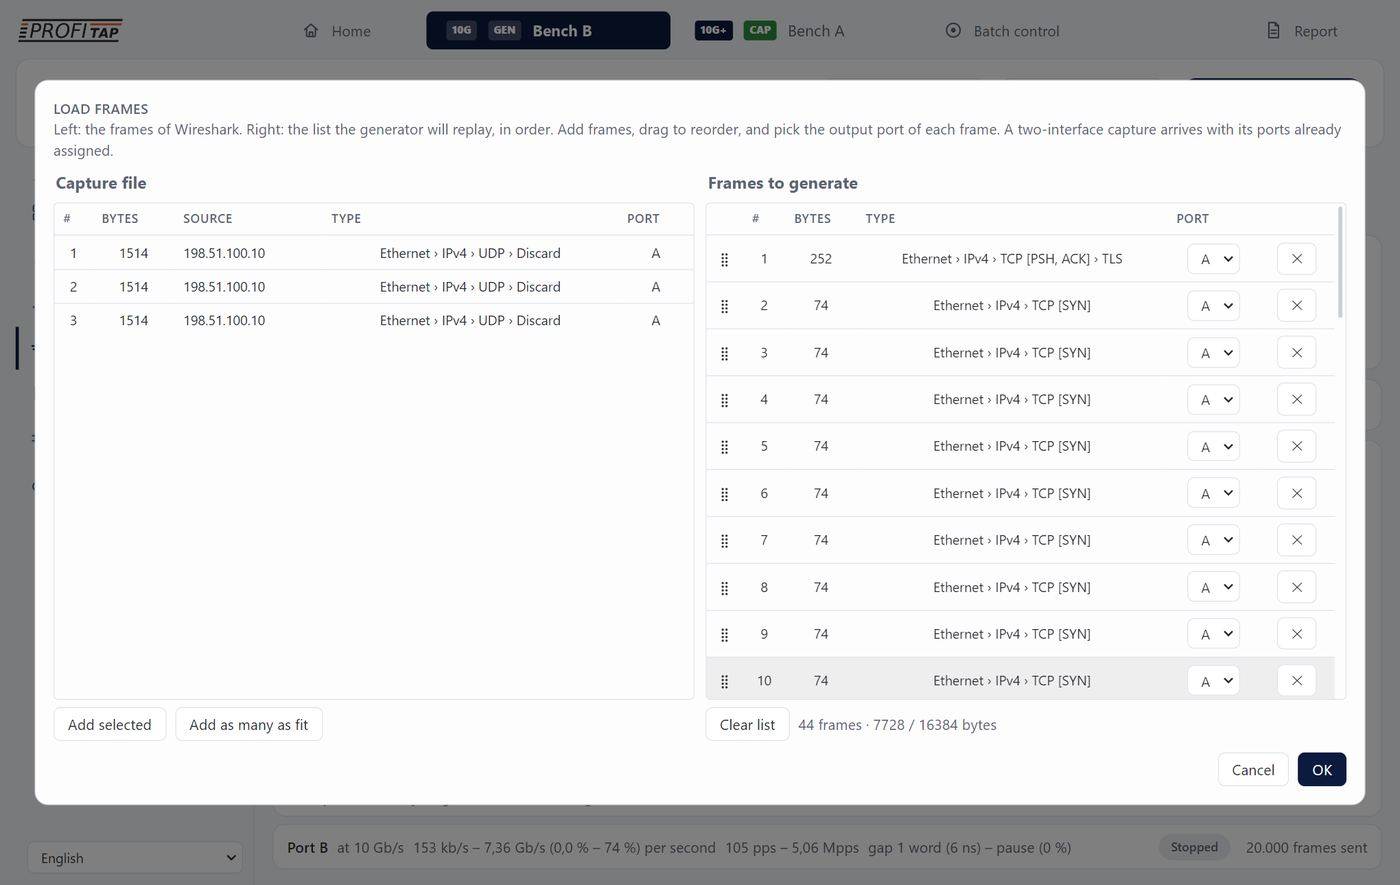
Tools › ProfiShark › Send displayed packets to the generator: the Manager comes forward with its frame picker, Wireshark's three packets on the left, the generator list on the right. Nothing is sent before Start.
In the Manager: it comes to the front on a ProfiShark in generator mode (and asks which one when there are several), then opens the frame picker with Wireshark's packets on the left. Choose what to add and click OK, or Cancel to leave the list as it was. Nothing is transmitted until you press Start. A further send while the picker is open waits for it.
5.6 From the Manager to Wireshark
| Where | Button | Opens |
|---|---|---|
| Home | Open a capture in Wireshark… | Any capture file you choose. |
| Home | Merge captures… | Two or more captures merged by time (mergecap) and opened: for two ProfiSharks on GPS time. |
| Capture | Open in Wireshark | The newest capture file of the capture folder. |
| Capture | Live in Wireshark | A live capture of this ProfiShark through the capture plugin. |
| Packet Generator | Open in Wireshark | The selected frames, port A and port B as two interfaces. |
| Microbursts | Open in Wireshark | The capture file holding the selected events, filtered to their seconds and senders; during a live capture, the filter is applied in the running Wireshark (section 3.3). |
Wireshark started from the Manager uses the ProfiShark profile when Open Wireshark in it is on (Home › Wireshark), and your current profile otherwise.
5.7 Two ProfiSharks, one latency
The dissector recognises the same frame seen on two interfaces: two ports of an inline ProfiShark, or two ProfiSharks whose captures were merged. Such a frame shows:
- Time since first seen (
profishark_blocks.match.delta), the Seen before column; - First seen in frame and on interface;
- Hops between, the TTL difference.
Between ports A and B of one ProfiShark this is the time a device inline added; between two ProfiSharks synchronised to GPS it is the one-way latency from one point to the other.
5.8 Field reference
The fields you are most likely to filter on. Type profishark_blocks. in Wireshark's filter bar for the full list.
| Field | Meaning |
|---|---|
profishark_blocks.subtype | Present on every ProfiShark block; !profishark_blocks.subtype keeps the traffic only. |
profishark_blocks.port_letter | ProfiShark port, “A” or “B”. |
profishark_blocks.received / .accepted / .dropped | Frames received, kept by the filter, dropped (cumulative). |
profishark_blocks.sync.disciplined | Clock disciplined to a PPS. |
profishark_blocks.sync.gps_fix | GPS fix. |
profishark_blocks.deviation_ps | Deviation from the PPS, in picoseconds. |
profishark_blocks.mb.port | Port of a microburst record. |
profishark_blocks.mb.bursts | Bursts in that second. |
profishark_blocks.mb.peak | Backlog peak, bytes. |
profishark_blocks.mb.start_ns / .duration_ns | A burst's start (ns since the epoch) and duration. |
profishark_blocks.mb.sender.mac / .ipv4 / .ipv6 | A sender of the burst. |
profishark_blocks.match.delta | Time since the frame was first seen elsewhere. |
profishark_blocks.match.hops | TTL difference between the two sightings. |
profishark_blocks.expert.* | dropped, pps_lost, free_running, microburst. |
frame.comment | Markers written with Mark event. |
6. The command line
What it is for
Do from a script what the pages do by hand: start captures unattended, set filters and timing on a fleet, run a generator test from a saved configuration, check licences and firmware, on Windows, Linux and macOS with one grammar.
6.1 The programs
| ProfiShark CLI (1.29) | profishark-cmd (the Manager's command line) | |
|---|---|---|
| Windows | ProfisharkCLI.exe in the Manager's folder (C:\Program Files (x86)\Profitap\Profishark Manager\), which the installer puts on the system PATH. | profishark-cmd, in the same folder. |
| Linux | profishark-cli new (package profishark-1g-cmd, amd64 and arm64; .rpm too). The older name profishark-1g-cmd still works. | profishark-cmd, installed with the Manager package (Flatpak: flatpak run --command=profishark-cmd com.profitap.ProfisharkManager). |
| macOS | /usr/local/bin/profishark-cli new; the older name profishark-1g-cmd still works. | /usr/local/bin/profishark-cmd. |
| Particularities | Native, small. help after any command. | Runs the Manager's own core, so its answers match the window; --json on every command; also wireshark. |
Below, ProfisharkCLI stands for the program of your system. Commands marked M exist only in profishark-cmd, C only in the ProfiShark CLI.
Two names to watch. In the ProfiShark CLI, pktgen is the 1G-family PHY generator and the 10G generator is pktgen10g; in profishark-cmd, pktgen is the 10G generator. On/off switches are written --inline=off or --inline off.
6.2 Conventions
| Option or rule | Meaning |
|---|---|
-d, --device <MAC|n> | The ProfiShark, by MAC or by the index list prints (default: the first found). -d all for the timing set commands. |
-p, --port <A|B> | The port, for commands that take one (default A). |
--yes | Required for writes that cannot be undone (flash erase, raw register writes, module checksum correction…). |
--json (M) | The same answer as JSON. |
| Exit code | 0 on success; 1 when the device refused, lacks the function, the arguments did not parse, or a licensed function is not in the licence. |
6.3 Devices, features, ports
| Command | What it does |
|---|---|
list | The connected ProfiSharks: index, type, model, MAC. |
version | Versions of the tool, library, driver, SW and HW firmware. |
info, capabilities show | legend | USB mode and identifier; the capability mask and what each bit means. |
restart (or reset) | Restarts the ProfiShark. |
features show | Every feature, slicing, PPS compensation, GPS antenna delay. |
features set [--keepcrcerrors=] [--keepcrc32=] [--disablea=] [--disableb=] [--slicing=n] [--inline=] [--loopback=] [--timestamps=] [--syncts=] [--autonega=] [--autonegb=] [--antennadelay=ns] [--save] | Changes features (on|off, slicing 0–65535, 0 = off; --inline=off = SPAN mode). --save keeps them in the unit. |
features save, saved show | Save the features; show what the unit will apply at its next boot, with what differs now. |
portstatus, speed, phy, sfp | Link state and rate of each port; what copper ports advertise; PHY registers; the SFP modules. |
portcontrol set --portselection=a|b [--1000txfd=] [--100txfd=] [--100txhd=] [--10txfd=] [--10txhd=] [--autonegotiation=] [--symmetricpause=] [--asymmetricpause=] [--prefermaster=] [--forcerole=] (C), portcontrol save | What a copper port advertises. |
speedmode show, speedmode set [--port A|B] 1g|10g | The rate of each SFP port (10G family). |
mode show, mode set --mode capture|generator | Traffic mode of a 10G (generator is licensed). |
portpower -p A|B --power=on|off (C) | Powers a port's PHY down or up. |
power; [--clear] [-i s] [--count n] (C) | Supply voltages and die temperature (10G family). |
6.4 Capture
| Command | What it does |
|---|---|
directcapture start (-o <file> | --dir <dir>) [--pattern p] [--count n] [--size MB] [--loop] [--fileduration s] [--alignclock] [--localtime] [--maxcache MB] [--fullframes] [--stopiffull] [--nostats] [--comment t] (C) | Capture to disk. --count files (0 = unlimited), --size per file, --loop ring buffer, --fileduration seconds per file, --alignclock boundaries on round clock times, --nostats no statistics blocks. Pattern as on the Capture page. |
directcapture status (or capture), directcapture stop | State (running, cache, bytes written and dropped, files) and stop. |
capturestate | Whether a capture runs on the unit, whoever started it (this tool, the Manager, Wireshark), since when, and per port received, kept, dropped. |
memcapture start | get --file f [--seconds n] | stop (C) | A capture through the device memory, into a file for n seconds. On Linux and macOS get starts the capture itself, so start is optional there. |
mirror start | get --file f [--seconds n] | stop | A copy of the capture stream on this host, beside the running capture. |
rawframe show | on | off | Raw frames (preamble and FCS kept). |
metadata set [--comment t] [--hardware t] [--application t] [--clock t] [--porta t] [--portb t] | The descriptions written into the next capture files (Windows driver). |
marker [--seq n] (C) | Injects a marker frame into the capture. |
ProfisharkCLI directcapture start --dir D:\captures --count 24 --loop --fileduration 3600 --alignclock
6.5 Filters
| Command | What it does |
|---|---|
filter set [--mac] [--srcmac] [--dstmac] [--ip] [--srcip] [--dstip] [--port] [--srcport] [--dstport] [--vlanid], filter show [--saved], filter disable (C); filter record show | set <hex> [--enable on|off] (both) | The field filter; filter record reads or sets the raw filter record. Wildcards: aa:bb:*:dd:ee:*, 10.0.*.*; IPv6 in full. --mac, --ip, --port match source or destination. |
packet_type_filter set --<type>=on|off …, show, save (C) | Types: ipv4 ipv6 arp tcp udp icmp igmp https http ftp dns smtp pop3 dhcp ssh sip smb tcpfin tcpsyn tcprst tcppsh tcpack zerowindow quic l2other l4other vlan. |
typefilter show | set <mask> | save | The packet type filter as one 64-bit mask, covering every type including the newest. |
dpi enable [--dpitxt t] [--dpihex h] [--dpimask m], dpi disable | save | show (C) | Deep packet inspection: a 16-byte pattern and its mask. |
6.6 Timing, statistics, microbursts, Link Scope, tunnel
| Command | What it does |
|---|---|
timing status | Timing board, GPS fix, satellites (GPS, GLONASS, Galileo), PPS, sync, deviation, time source. |
timing config [--tssource=none|system|gps|rtc] [--waitforsync=] [--forcepps=] [--ppsoutput=] [--ppscomp=ns] [--portAts=] [--portBts=], timing save | The Timing page's settings. |
timing setsntp --sntpserver h | setgps | setmanual --timestamp s | setsystem (C, -d all allowed) | Sets the device clock. |
nmea (C) | The GPS receiver's NMEA sentences. |
statistics; [--continuous] [--delay ms] (C) | Per port: frames, bytes, CRC errors, sizes, frames dropped by the device and the driver. |
microburst status | summary | sources | events | enable | disable, burst and rate [auto|1g] (C), -p A|B | The microburst detector (licensed): peaks, per-second summary with the duration histogram, the senders, the recorded events, on/off, and the rate to measure against. |
diag eyescan start | abort | Arms a Link Scope sweep (the Manager's Link Scope page reads and draws the result). |
tunnel show, tunnel endpoint -p A|B <ipv4>|off [--vlan id], tunnel cut -p A|B [--offset n] [--rules …] [--drop-others] [--keep-arp] | --off | Tunnel termination (licensed): the endpoint and the de-tunnelling. |
profishark-cmd microburst sources --port B --interval 10 --json
ProfisharkCLI timing setsntp -d all --sntpserver pool.ntp.org
6.7 Packet generator (10G family)
Command pktgen10g in the ProfiShark CLI, pktgen in profishark-cmd. The 10G must run its generator firmware, loaded from the Device page (section 4.2; on a capture firmware the commands say so); starting is licensed. A gap is counted in 8-byte words of 6.4 ns.
| Command | What it does |
|---|---|
load --config f.json, load --pcap f [--fcs] (C) | Loads frames from a pcap (up to 255 frames, 16 KB) or a configuration saved by the Manager. |
start [--gap words] [--count n] [--config f], stop, status | Start (count 0 = until stopped), stop, running or idle with frames sent. |
send --count n [--salvos n] [--rate per_s] [--gap w] | Salvos of n frames, paced by the tool. |
profile set --shape=off|flat|random|sweep|triangle|square --from= --to= [--every=s] [--jitter=w] [--words] [--bytes=n|--config=f] [--run=lo-hi], profile show | The traffic profile the ProfiShark walks by itself. |
pps [on|off] [--lead ns] | Runs aligned on the GPS or external PPS. |
route [A|B|perframe] | Where the frames go. |
shape --percent n [--jitter n] | Re-aims the loaded frames at a share of the link. |
update --config f, show --config f, layout, export --pcap f [--config out.json] (C: export only) | Rewrite the gaps and modifiers of a loaded configuration; describe a configuration offline; turn a pcap into a configuration to edit. |
serve --file frames.json (M) | Keeps the device open and takes rate, shape, start, salvo, stop, status, quit on its input — changes the rate with no gap in the traffic. |
ProfisharkCLI pktgen10g load --config test.json
ProfisharkCLI pktgen10g start --config test.json
profishark-cmd pktgen profile set --shape=triangle --from=90 --to=10 --every=2 --bytes=1500
The configuration file ("format": "profishark-pktgen10g") is the one the Manager's Save config writes: the port gap, the count, whether gaps replay the capture, and for each frame its bytes in hex, gap, gap max, address modifiers (none, increment, decrement, random), bad FCS and raw preamble. Unknown keys are ignored, so the Manager's own section does not disturb the command line.
The 1G-family PHY generator (C): pktgen start [-p A|B] [--count n] [--length 64|125|1518|10000] [--random] [--pattern 0xNNNN] [--lowrate] [--badfcs], pktgen stop, pktgen stats.
6.8 Firmware, licence, Wireshark, tests
| Command | What it does |
|---|---|
update (--firmware f | --sw f | --hw f) [--restart] | Writes a firmware; do not unplug during the write. The new firmware runs after a restart. |
recovery status, recovery boot <image> | Whether a ProfiShark waits in its boot loader (and whether its driver is missing); starts a firmware from memory — then update --sw writes it to the flash. |
license show | refresh | State, plan, expiry and features of the licence; read it again. |
license activate <key>, license renew (M), license install <file> | Activate a key (online with profishark-cmd), renew, install a licence file. |
license offline-request <file> [--key k], license answer <request> <licence> (M), license offline-activate <file> | The offline flow: request on the offline computer, answer on a computer with Internet, install the answer. |
license verify <file> | Whether a licence file is genuine, and for which ProfiShark. |
wireshark status | install | update | uninstall [extcap|dissector|plugin] (M) | The Wireshark pieces, as on Home. |
cabletest 1g -p A|B (C), cabletest start (SPE), cablediag | Cable test of a copper port (link down) or the 10BASE-T1L diagnostics. |
sfpeeprom read | write | probe | password | fixchecksums | Read or rewrite an SFP module's EEPROM (pages A0h / A2h), when the module allows it. |
ProfisharkCLI update --firmware ProfiShark-10G-update.bin --restart
ProfisharkCLI license offline-request req.txt
profishark-cmd wireshark install
Other diag commands (registers, transceiver access, flash erase) are for Profitap support.
7. Workflows
Find who caused a microburst
- On the Capture page, switch on Microburst records in the file and start the capture (or start a live capture in Wireshark with the same option in the Features tab).
- On Microbursts, watch the timeline; the Senders table names who sent each burst.
- Select the sender or its events and click Open in Wireshark: the file that holds them opens, filtered to those seconds and senders.
- In Wireshark, click Microbursts, right-click a burst › ProfiShark › Filter on this burst and press Enter to see the frames of that burst only.
Check a capture for losses
- Look at the capture strip: yellow seconds had drops.
- Open the file in Wireshark and click Drops: the seconds in which the ProfiShark dropped, per port.
- Statistics › Capture File Properties gives the totals per interface.
- If the load is close to the USB link's capacity, slice the frames or filter in hardware (section 3.9).
Replay a conversation through a device under test
- In Wireshark, select a packet of the conversation and apply Conversation Filter.
- Tools › ProfiShark › Send displayed packets to the generator - port A or B by direction.
- In the Manager's picker click OK. Keep capture deltas for the recorded timing, or set gaps by hand.
- Connect the device under test between ports A and B and press Start.
Craft a malformed or unusual frame
- Add a packet from the menu, or send one from Wireshark with “Edit this packet”.
- In Packet View, add a VLAN, change the transport, edit fields; switch off Keep checksums correct to send a wrong checksum on purpose.
- For a runt, set the size under 64 bytes (down to 10): the frame goes out raw with its own preamble and FCS.
Measure the one-way latency between two sites
- Two ProfiSharks with GPS, both disciplined (Timing page), one at each end.
- Capture on both at the same time.
- Home › Merge captures… with the two files: the Seen before column gives, for each frame seen at both ends, the time it took.
8. Windows, Linux, macOS
Windows
Driver signed through Microsoft's hardware programme. It writes the self-describing capture files and the per-second statistics; the microburst records in the file come with driver 1.4.38. A cable pulled during a firmware update no longer stops Windows.
Linux
Per-kernel driver packages for Debian 11, 12 and 13 (amd64, and arm64 for 12 and 13), Ubuntu 22.04, 24.04 and 26.04 and Kali, plus a DKMS package (.deb and .rpm) that rebuilds for each new kernel. The Manager as .deb (amd64, arm64) or Flatpak; the capture plugin for both architectures. The driver writes the same capture-file blocks as Windows.
macOS
Apple silicon. A DriverKit driver extension installed by the ProfiShark Driver app (it replaces the old kernel extension, which the installer removes). The package is signed and notarized by Apple: double-click it and follow the installer. Then open ProfiShark Driver (Applications), click Install, and allow it when macOS asks: System Settings > General > Login Items & Extensions > Driver Extensions, switch ProfiShark Driver on and enter your password. A ProfiShark already plugged in is taken by the new driver after a restart of the Mac new. The command line and the capture plugin are installed as signed bundles, linked into /usr/local/bin and Wireshark's extcap folder. Capture to disk runs through a small helper installed with the Manager and the command line. To remove everything, run /Library/Application Support/Profitap/Uninstall ProfiShark.command (it asks for an administrator password and removes the driver through ProfiShark Driver first) new.
9. Versions
Firmware and FPGA images ship inside the Manager, so a ProfiShark is brought up to date from the application.
| Component | Version | Notes |
|---|---|---|
| ProfiShark Manager | 5.3 | Windows, Linux (amd64, arm64, Flatpak), macOS |
| ProfiShark API library | 2.6.22 | Capture metadata and statistics, generator, timing, filters, licence; on macOS, memory capture, unit detection and firmware recovery |
| Wireshark capture plugin (extcap) | 1.5 | Tabs, toolbar, hardware filter, microburst records |
| Wireshark dissector and profile | 2.0 | Ships with the Manager, installed from Home |
| Wireshark timestamp plugin | 4.2 · 4.4 · 4.6 · 5.0 | Windows, Linux, macOS (Apple silicon and Intel) |
| Command line | 1.29 | Ships with the Manager |
| Windows driver | 3.0.0.0 | Signed by Microsoft; a memory capture stops when the program that started it closes; faster FPGA update |
| Linux driver | 3.0.0 | Per-kernel and DKMS packages; a memory capture stops when the program that started it closes; faster FPGA update; NetworkManager brings the ProfiShark up with no address (no DHCP) |
| macOS driver extension | 3.0.19 | DriverKit; microburst records, raw frames, GPS with Galileo; a memory capture stops when the program that started it closes |
| Device firmware | 0.2.5.19 | One firmware for every model; each model names itself on USB (a 1G read “ProfiShark SPE” before); an SPE restarts on its own after an update |
10. Troubleshooting
| Symptom | What to do |
|---|---|
| Home says Wireshark is not installed although it is (Windows) | Since 5.1 the Manager asks Windows where Wireshark is installed, on any drive. With an older Manager, update it. If Wireshark is a portable copy (no installer), install Wireshark normally. |
| The ProfiShark is not in Wireshark's interface list | Home › Wireshark: install or update the capture plugin, then restart Wireshark. Check the ProfiShark appears in the Manager. |
| No Port column or filter buttons in Wireshark | Choose the ProfiShark profile in Wireshark's status bar, or install it from Home. |
| The ProfiShark menus are missing in Wireshark | Install or update the ProfiShark dissector from Home and restart Wireshark (or Analyze › Reload Lua Plugins). |
| ”Send to the generator“ does nothing visible | The Manager comes forward only for a ProfiShark in generator mode; switch a 10G to its generator firmware on the Device page. Check that the Manager was started once on this computer (it records where it is installed). |
| The Manager says “Capturing elsewhere” | Another program (often Wireshark) holds the memory capture. Stop it there, or stop it from the Capture page after the confirmation. |
| ”Microburst records in the file“ is greyed | The driver on this computer is too old (install the ProfiShark software of this release: driver 3 on every platform), or the licence does not include the microburst detector. |
| Open in Wireshark from Microbursts finds no file | No capture was running when the bursts happened, or the ring buffer has deleted that file. The capture strip shows which seconds are still on disk. |
| Drops downstream of the generator | Check the traffic shaping profile: a sweep or random profile varies the load on purpose. |
| A ProfiShark no longer appears after a failed update | Use Recover firmware in the banner above the tabs (section 4.3). If the banner says the boot loader's driver is missing, reinstall the ProfiShark software and replug. |
| Only the Device page is shown | The unit needs a firmware update: click Update on the rows marked “needs” (section 4.1). |
| A licensed page is locked | The licence does not hold that feature, or has expired: see the Licence page (section 3.15). |